
Abstract
The history of liner shipping and containerization demonstrates that liner shipping has been constantly improving, driven by competition, consequently leading to lower unit costs. In the last decade emphasis has been on reducing emissions and greenhouse gasses.
This article is about a duopoly in a small market, Iceland, the Faroes and, in the near future, Greenland. In this market, the manifestation of duopoly competition is 50% more fuel consumption than would be needed if handled differently with largely the same service level. This market is unique due to its small size and distance from main ports. The competitors are focusing on market-share and preventing competition from newcomers, rather than profit. Price discrimination is helped by vertical integration and cross subsidies.
In short sea shipping there are three levels of unitized transport, LoLo, RoRo and trailers with accompanied drivers. The LoLo service is slow, reliable and less expensive, while, the accompanied trailer service is fast and more expensive. Distance from main markets has resulted in containers having the greatest share in the market. Iceland is a LoLo market. This article looks at the current services, volumes, the ships and their cost.
Seeing the basic liner service as an infrastructure, where the objective is to facilitate movement of containers at a service level not worse than the current one, at a cost considerably lower than the existing one, is an option which will be explored.
Keywords: Duopoly, Natural Monopoly, Contestability, Uneven Competition, Small markets.
1. Introduction
Wikipedia defines Duopoly as “..form of oligopoly where two sellers are the biggest in one market. In practice, the term is also used where two firm have dominant control of a market”. In the abstract of an article named Duopoly by James W. Friedman in the book Game Theory, the first part of the definition is “A duopoly is a market in which two firms sell a product to a large number of consumers. Each consumer is too small to affect the market price for the product: that is, on the buyers’ side, the market is competitive. Therefore, in its essence duopoly is a two player variable sum game. Each of the two duopolists is a rational decision-maker whose actions will affect both himself and his rival. Although the interests of the duopolists are intertwined, they are not wholly coincident nor wholly in conflict. In contrast to the agents in competitive markets, the duopolists must each concern themselves with what the other duopolist is likely to do.” In a duopoly situation the focus is more on the competition than the customer, which can be common in most business but probably at its worst in the situation described in the article.
In a presentation about the North European RoRo market at IAME in Mombasa 2018 Professor Johan Voxenius mentioned that one of the world’s largest shipper ships 500.000 teu per year, but no line has offered them any modification to their way of doing business, like itineraries and sailing times. A.P. Möller – Maersk Annual Report 2017 states that the company carried 21,4 million teu. If all the volume had been with Maersk, its share of total teu had been 2.3%.
This article is about a market where several customers of the main carriers are likely to control more than 3% of the containers carried. It will be discussed whether Each consumer is too small to affect the market price for the product. It matters what is included in the product.
The are several methods on assessing market concentration. One is CRx. CR4 is easy to assess in our case, as there are 4 players with 100% market share. CR3 99% and CR2 90%. Christa Sys (2010) says that market with CR4 higher than 40% is an oligopoly. The Herfindahl-Hirschman Index for the market in question will be in the range of 4-5000. There have been red flags about much less concentration, but the literature has neither discussed prediction of the effect of the concentration nor has a remedy be provided.
ITF is now questioning the exemption for global container alliances, as the 3 alliances reduce the choice of the shippers to 3 schedules. If the exemptions will not be extended, the 8 members will be on their own, where the smallest, Yang Ming, will be 1/6th of the largest, Maersk.
There is though no indication that the concentration on the main trade-lanes has resulted in higher freight rates. Enna Hirata´s (2017) study of concentration states: The empirical results reveal that HHI does not have statistically significant impact on and demonstrates non-increasing relationship with freight rates. She also concludes that container rates in every major route have dropped faster than the gains in productivity in the context of the race for ever larger tonnage, which must be filled through greater concentration in the industry.
Most of Drewry’s Container Insight Weekly articles (2014 -2019) highlight the connection between supply of capacity and the development of market rates. The headline of article by JOC´s Greg Knowler, 160419 states Capacity cuts keeping Asia-Europe rates afloat, where there is a reference to statement by SeaIntelligence Consulting.
Haralambides (2003, 2019) has warned against the destructive competition if the carriers are left on their own. He has questioned the benefits of where the search for the economies of scale has led the industry and the part of the equation where the owners of the ports the megaships are calling, must subsidize the lines’ crusade towards ever larger ships, is ignored.
In this article, a situation is described where for decades there have been 2 players, Eimskip and Samskip, which will be called the Competitors when the discussion is about both, with close to 100% of the commercial market in Iceland. No attempts have been made to benefit from the economies of scale in ship-operation through some form of cooperation. The Competitors go to extreme lengths to sign up new customers or retain the existing ones, leading to an industry where, despite duopoly, the profits of the main player in 2017 at the peak of the economic cycle are dismal and lower than the previous year.
The definition of the geographical market described in this article is in line with EU´s C245/, 26.9.2008 and related documents, shipping services between North European ports and ports in Faeroes, Iceland and Greenland where goods are carried in containers and trailers with container ships and RoRo and RoPax ferries. Here references are drawn from Ireland where ferries carry the majority of inter-European unitized goods. The difference is twofold, the distance makes the RoRo less competitive as the construction cost and the fuel cost is much higher than of LoLo ships, as explained by Santos and Soares (2017). Then the distances make round trip only possible once a week instead of many times per day as is the case in Ireland. It makes 14 days round trip of containerships the natural way of running container operation which with proper terminal facility in Reykjavik would allow for use of larger containerships than have historically been used in North-European trade.
In 1994 Drewry made a report, The Icelandic Container Market in International Context, on behalf of the Icelandic Association of Wholesalers. The report highlights;
The wharfage is significantly more expensive than in US and Europe and is based on weight and commodity instead of box rate. No independent terminal operation.
Independent international forwarders mostly absent
The cost of countries’ container transportation is many times the cost for other markets.
Drewry compared the freight rates between Europe and Reykjavik and to and from Lisbon. The cost of TEU to Iceland was $ 2,506 and from was $ 1,722. The Portugal rate was $ 575 both in and out. The distance from Rotterdam to Reykjavik is 1,174 Nautical Miles (nm), and to Lisbon 1.122 nm. The distance is 4.6 % longer to Iceland while the average rate is 3.7 times higher.
No such survey has been made since and there is no information available on rates. This duopoly is supported by absence of any intelligent discussion about this market, the pricing and service. The Icelandic Competition Authority has a close eye on the development and there were cases where the Competitors were accused of collusion in pricing or one accused the other of illegal activities in terms of the Icelandic competition laws.
The theory of contestable markets, which substitutes potential competition for the active participation of many sellers (Coyle, Bardi Novack 2006). Brooks (2000) says that theory is based on the competitive consequence of potential entry. “Contestable market refers to a market where there are only a few companies that behave in competitive manner because of the threat of new entrants. A market deems to be contestable if entry and exit are relatively easy.” Enna HIRATA, (2017). The theory was applied in discussion about air transport where access to airport and terminals are in principal open to new competitors. In general, where barriers to entry and exit are surmountable. Christa Sys (2010) maintains that no market is perfectly contestable, and that “virtually every market is contestable to some degree”.
In the transport system described in this article the basic condition for access to market/ contestable market is absent as there is no common-user terminal in the main port of the system, Reykjavik and a new entrant would have to invest in a container terminal if the land was made available, which would be largely sunk cost if the entry was not successful.
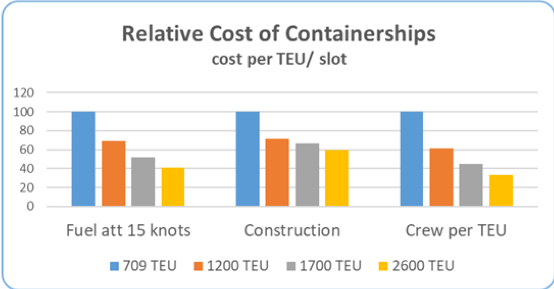
Figure 1 - Relative Cost of 700-2600 TEU Containerships.
Cost of fuel is based on Stopford 2009, construction cost based on information from Allied Weekly Market report, week 5 2019, Alphaliner issue 09 2019 and Santos and Soares 2017, Methodology for ro-ro ships and fleet sizing with application to short sea shipping, Crew cost loosely based on Drewry Webinar, Ship Operating Costs 2018 Trends, recording 20 Feb 2018.
In the early days of containerization, some 25-30 years ago, the containerships used were much smaller than would be optimal today, 250 – 500 TEU. Entering a market with 2 such ships wouldn’t have been unsurmountable as i efficiency of the ships would be similar to the existing fleet. To enter the market with a ship which is of less capacity than the average size of the current fleet operated would make the ship operation uncompetitive cost wise. In this article it is maintained that the optimal size of the ships serving this market or at least Iceland and Faeroes should be 1700 – 2500 TEUs. The unit cost TEU-leg would be a third to 50% higher for an entrant with 880 TEU ship compared with the 1700 – 2500 TEU option. Sys (2010) statement, that every market is contestable to some degree, was proven with the entry of a RoRo service which didn’t use the port of Reykjavik in a weekly fast service to Rotterdam and Torshavn. The production cost of such service is much higher than of LoLo service, so a limited part of the market is likely to support this initiative in the future.
While Samskip is privately owned, Eimskip is listed on the Icelandic stock market. Eimskip’s profits in 2017 was 2.5%, down from 4.2% the previous year. This can be compared with DFDS, a company with large presence in its markets as Eimskip has. DFDS profit in 2017 was 11.3%, slightly higher than the year before. DFDS turnover was 2.9 times Eimskip´s turnover.
The Competitors engage in foreign operations, Eimskip focuses on palletized reefer shipping, while Samskip runs container and intermodal service using 45’PW containers service in North Europe and is said to be one of six largest feeder operators in Europe (ITF 2019).
Samskip has only made minor gains at Eimskip’s cost in the last quarter of a century. Large customers rarely shift allegiance, and when that happens, the other party retaliates, offering the other’s customers lower rates, which at times are accepted but more often the defending party must match or improve on the existing contract with the customer the other has approached.
This type of competition can be called a fight for trophies rather than improved bottom line, as the tricks and retaliations are known to both parties. The networks are designed to replicate each other.
This article questions whether the current setup is optimal and explores the notion that a duopoly delivers a very expensive solution. It will be explored whether a solution based on treating the containerized trade as utility or infrastructure will deliver the same utility for the importers and exporters of Iceland and will benefit the society in general. If the ship operation is run like a utility, prohibited from selling directly to the market, becoming a wholesaler with reference to Haralambides (2019), the retailers would be competing for the business.
Is it appropriate to compare the trade between small islands and to and from the continent with trade on large ships between continents, just because they are carried in similar containers and use similar terminal facilities? In this article, some comparisons will be drawn between the global container liner business and the ones in the islands in the North Atlantic. It is appropriate to analyse/understand the difference in unitized transport between small islands in the North, and the main markets with Ireland which has in common with the islands in the North to be an island, but the difference lies in the larger population and shorter distance to main markets.
This article is based largely on literature review and statistical analysis, mixed with decades long insight by the author into this market. The shortcomings of this article are due to lack of Icelandic statistical data.
2. Supply chains in the North
What Iceland (population 338’) has in common with its neighbours, Greenland (population 56’) and Faeroes (population 49’) is small population and most of the goods used comes from abroad, mainly on ships, 100% of the Greenland trade, and well over 90% of the Icelandic trade and approximately 80% of the trade with Faeroes is carried in standard shipping containers.
The difference is that Greenland has never had free market sea transportation, a combination of very small market and long distance to other markets. Faeroes on the other hand is sufficiently close to other markets for the theory of Contestable markets to be applicable. The participation by the Competitors in Faroes market is likely to be priced based on potential entry of newcomers with relatively low barriers to entry. There has always been oligopoly in Icelandic shipping and the distance from larger markets and absence of common user terminal in Reykjavik make the threat of newcomers less potent than in the Faeroes.
2.1 Ireland
Ireland has a population of 4.8 million and is more self-sufficient than the islands in the North. The distance to the UK and the continent is short and there are several ferries every day both from the UK and the continent. The main export products are machinery and equipment, beverages, basic metals, and pharmaceutical products. The main markets are in Europe.
The total weight of unitized goods to and from Ireland is 23 million tons, 4.8 tons per capita, and equivalent to 3.4 million teu when trailer load has been converted to 2.2 teu. Thereby 798 teu per 1000 inhabitants. 68% of the volume is carried in RoRo and RoPax vessels and 32% in Container vessels. 86% of containers on container ships are moved between Ireland and other EU countries. 12% are between UK and Ireland. 80% of trailer traffic is between Ireland and the UK, while 16% is between Ireland and other EU countries. Included in the UK volumes are trailers continuing over England to Dover to catch a ferry to Calais, the Land-bridge. The total door-to-door transit time is as low as 20 hours and large part of the North European market can be reached within 30 hours. This is used by the most time-sensitive cargo to the Continent, which value wise is a large proportion of the trade. The 20-30 hours’ time window is similar to export by air from Iceland to the Continent, which comes at much higher cost. The capacity of the airplanes is limited, while the Land-bridge is more expensive than direct ferry, has more departures, and significantly more expensive than using container ships. In very short, there are containerships offering inexpensive and rather slow service to the Continent and UK. There are faster and more frequent ferries to the UK and to lesser extent to the Continent where 40% of the trailers are accompanied, ensuring very short transit time contributing to interlinked supply chains between Ireland, UK and the Continent
Iceland has limited air cargo capacity at very high cost and the two ferries, Thorlakshofn to Rotterdam and Seydisfjordur to Hirtshals offer the same flexibility as the containerships in Ireland, longer transit time and few departures. Iceland is therefore a LoLo country.
3. Competition
Understanding the status and history of competition in Iceland, which is by far the largest of the 3 economies, it is good to look back some 30 years;
3.1State control replaced with the market
Containerization replaced conventional liner operation in the eighties. For two decades there were 3 main competitors in the liner trade, until one of them, Hafskip, went bankrupt. The two remaining contenders, The Competitors, shared Hafskip’s market, though not evenly.
Until 1994 the pricing of transportation, haulage and coastal sailings, was subject to approval and the rates were published. The abolition of the price control in domestic transport resulted gradually in much higher official freight rates and somewhat better service. The rates were not equally applied. In a report from 2003 by the Ministry of Transport on the development of domestic transport, it is stated that official rates were selectively applied. Quantity discount were given, which gradually led to the smaller retail units in the countryside lost ground.
From 1992 the Competitors were competing in the coastal service. When Samskip ceased costal service in the year 2000, the pricing of the total transport cost from abroad to a consignee in a coastal town was no longer inclusive the leg to the port of discharge as before. Now the on-carriage by road was charged separately. This was then applied by both Competitors. Eimskip discontinued the service at the end of 2004 and used trucks.
3.2 Expansion and return to coastal service in 2013
Next few years seem to have been generous to the Competitors. Both embarked on expansion abroad mainly by acquiring other transport companies, like Geest acquired by Samskip and control of Containerships acquired partly by Eimskip. The acquisition of Innovate, a UK based haulier was disastrous contributing to the bankruptcy of Eimskip. Many of the acquisitions were done in a bidding match where the two participated. The meltdown of the Icelandic economy in 2009 led to restructuring of both companies.
Officially it was due to pressure from the government and customers that coastal service was recommenced in March 2013. Samskip and Eimskip operated identical ships and identical itineraries, initially fortnightly, then weekly. They called the same ports on the same days, almost same hours. There was request from a port for governmental support to extend the quay to accommodate the ships. This service was relevant to 3-4 ports, exporters of seafood and construction material were using it and some importers. The main services continued as before with outbound direct calls of the UK/Continent services to Vestmannaeyjar and Reydarfjordur.
It is believed that the in 2017 the total number of teu shipped were 18,000, 12,300 full and 5,700 empties. Carrying these containers by road would have resulted in driving 3.6 million km using 111 kg of relatively clean diesel per paying teu. The ship alternative, based on two ships competing, needed 597 kg of one of the most polluting fuel per paying teu. The cost is similar, but significant environmental deficit for the sea alternative.
IF the Competitor managed to have a combined service, one per week instead of two, the fuel required would be 298 kg, which is almost three times the weight of fuel compared with the road alternative. The total cost of shipping in the IF alternative is calculated as $ 287 per paying teu, $ 363 less expensive than the truck. If the Competitors offered 45’HCPW containers the trips could be fewer and the difference in cost of the alternatives almost negligible.
4. Economies of container shipping
The history of liner shipping is of constant search for improved economic performance through larger and more economical ships. The development of containerization was the answers to many shortcomings of the liner shipping. Recently, additional incentive for improvements have been demands on shipping to reduce negative environmental effects of operation, so where previously lower fuel consumption was great for the bottom line, now it is a necessity to meet the of the Energy Efficiency Design Index, EEDI requirements. Larger and more economical ships have led to cost reduction contributing to growth in container transportation expressed here by comparing the global fleet of 1.2 million teu in 1980 to 22.4 million teu in 2017.
The first pure container ship in the Icelandic fleet was Bakkafoss 116 teu built in 1970, acquired in 1974, in service until 1982 and was intended for container service between Iceland and the US. The largest ships in the trade are 1457 teu, Godafoss and Dettifoss, built in 1995, acquired in 2000. They are to be replaced by 2150 teu newbuildings at the end of 2019.
The liner industry has made great progress in the last 2 decades, and newer ships are more economical than older ships, Alphaliner Issue 05 2019 reported that charter rate for a standard 1730 teu ship was around $ 7,000 per day while a modern CV Neptun 1700 were “fixed in the high of $ 10,000 per day”. The rated difference represents over 17 tons of fuel per day.

Table 1 - Development of Maersk’s containerships.
Each generation of Maersk containerships has been a step forward, Regina in 1996 to Maersk Hong Kong in 2017, which has more capacity than Emma, with lesser dimensions and engine.
In Martin Stopford‘s book Maritime Economics (2009) “The eight building blocks of liner costs” are presented. The clarity is outstanding while the cost elements changes over time. The bunker cost fluctuates and since the book was published, demand for cleaner fuel has been mandated, Sulphur Emission Control Areas (SECAs) where 0.1% maximum sulphur content is enforced and in 2020 the maximum sulphur content in ships fuel operating outside SECA’s will be reduced from 3.5% to 0.5% which will lead to higher fuel cost. Shipbuilding cost is affected by cost of steel, improved technology and competition. Finance cost is affected by fluctuation on the financial markets. Cost of crews are included in the Operating Cost, has been stable in the last few years. Other cost elements outside block 4, “Ships cost $ per day”, are not of direct interest in this article, except block 5. In block 5 Port and Charges excluding cargo handling are mentioned. As this cost is insignificant it will not be discussed further. Other cost included is cost of containers; ownership, maintenance and repositioning, - and administrative costs, are unaffected of whether the ship used is bigger or smaller in the context of this article.
4.1 Ships
In Cariou P. et Al, Towards low carbon global supply chains: a multi trade analysis of CO2 emission reductions in container shipping, presented at the IAME conference in Mombasa in September 2018, they argue that from 2007 to 2017 the use of fuel expressed as g/teu kilometre has been reduced by 53% on 8 of the busies trade-lanes in the world. They list 4 determinants, (i) Impact from Size and Technology, (ii) Impact from commercial speed where the speed had been reduced by 15-28 % most on the busiest trade lane and least on the lesser trade-lanes like Europe-Africa and Asia-South America. (iii) Impact from network design (iv) impact from relatively lesser time spent in port.
A ship is designed for optimum power for certain speed which is the maximum speed which can be obtained before increased resistance makes further increase in power futile. When the speed is reduced, the lesser water resistance causes the reduction in fuel consumption (actual speed/ designed speed) to be affected by the cube of the difference between the designed speed and the new speed. Reducing speed from 17 knots at consumption of 26 ton per 24 hours to say 14.5 knots will result in consumption of 16 ton, 38% reduction in consumption caused by 14.7% reduction in speed. Ships have generally two draught conditions, Design draught is for the most common operational condition and the design of the hull and the engine specification are based on the best use of the vessel under those conditions. Scantling draught is the maximum draught allowed. As an example, 1730 teu ship at 18 knots consumes 45 ton fuel at scantling draught, 10,9 m and 36 tons at design draught 9,5 m.
4.2 Sea Margin
The cube rule is used to find the consumption at calculated speed. Sea margin must be considered. It includes two elements, effects by the environment like wind, current and sea state, - and effects of deterioration like fouling and corrosion of hull, propeller and machinery system. One definition of Service Margin (Swift 1975) is Allowance for the difference in the power requirements of the ship in its trial condition and its average service conditions.
It is common to mention 10-15% sea-margin on top of calculated power for propulsion. These are arbitrary figures, while operators and the academics have contributed to better understanding of what is appropriate margin at certain condition and trade. In an article by Szelangiewicz and Żelazny, Maritime University of Szczecin, Ship service speeds and sea margins, where sea-margins of 3 container vessels are observed, 140 m long vessel similar the 880 and 908 teu vessels mentioned later, 172 m vessel and 210 m long vessels. The authors maintain that a 25% sea margin is needed for the smallest category, 14% for the second category and 13% margin needed for the 210 meter one (2500 teu).
For ships not intended for higher speed, the trend has moved towards wider hulls, making them more box shaped in order to reduce the use of ballast. As the ballast increases, the draught increase with corresponding increase in the fuel consumption.
4.3 North European trade
The history of the largest trade routes and the ships used is well documented. This article focuses on the use of different ships in different waters. When looking for a trend closer to the area in focus, for the first decades of containerization, it is tempting to look at the ships built by Sietas, a German yard, gradually increasing the size of their newbuildings. Yard number 784 carried 210 teu built in 1976 for 14.5 knots speed, main engine 2,650 kW. Yard number 898 built in 1983 carried 541 teu made for 16 knots speed with 2,940 kW engine. Yard number 1172 built in 2005 carries 909 teu, made for 18,2 knots with 8,400 kW engine.[1]
Short sea vessels in North Europe are mainly under 1,000 teu. 49% of the containerships calling Dublin in 2018 were 800-1,000 teu and 29% were larger. In 2016, the 800-1,000 teu were 29% and 19% were larger. EUCON the largest LoLo operator in Ireland has acquired 1421 TEU ship for the Ireland Continent trade, reported by Alphaliner 15-2019.
In the Baltic, Containerships now owned by CMA-CGM, ran at the beginning of 2017 container services with 8 vessels 803 to 966 teu (thereof 5 built by Sietas). They ordered 4 1400 teu ships. Now CMA-CGM is receiving 3 2487 teu ships and thereby the combined operation of Containerships and CMA-CGM has got a much more economical fleet with larger units. Their competitor, Maersk has gone a step further with series of 8 ships, 3596 teu which replace fleet of 1000 - 1400 teu ships for Baltic and North Sea services.
5 The current network and volumes
Iceland does not have an adequate transport statistic. Only Faxaflóahafnir, has a reasonably good container statistic. Fragmented information from the Icelandic Road and Coastal Administration, IRCA is used. Eurostat has statistics on weight of goods in containers and trailers through ports in Europe to various destinations, amongst them Iceland, Faeroes and Greenland. Danish statistics is used for goods to and from Denmark. The Greenlandic trade goes mostly through Denmark as goes most of the Faroes trade. Transport statistics between Iceland, Faroes and Greenland is non-existing. What follows is based on information, believed to give an adequate picture of the flow of unitized goods.
5.1 Iceland
The total volume in containerized transport through Icelandic ports is estimated to be in 2017 427’ teu; 2,489’ ton, thereof 65% of the volume are through the Dutch ports of Rotterdam and Vlissingen, 1,622’ton, thereof 460´ton for one smelter. The second biggest trading partner is Denmark with 14% of the volume. 9% were though the port of Immingham.
Mykines, RoRo ship, between Rotterdam and Thorlakshofn for the 9 months of operation in 2017, carried 41’ ton. This is 1.65% of unitized trade. RoPax service from Seydisfjordur in the east of Iceland to Hirtshals in Denmark through Torshavn has been growing. Total Roro goods was in 2017 78’tons 3% of the total unitized volumes. Adding and converting the RoRo traffic to teu, the total number is close to 437’ teu. 1,263 teu per 1.000 inhabitants.
5.1.1 Past and potential developments
Increased volume in Iceland can be explained by an increase in aluminium production, increased population, higher purchasing power, and an increase in the number of tourists in Iceland (from one million in visitors in 2014 to 2.2 million in 2017). Greater share of the demersal fish is now exported fresh and is the main commodity on the RoRo services.
5.1.2 Processed and frozen pelagic catch
Average shipped volumes of pelagic catch 2016-2017 were 115’ tons per year. 7 countries buy 79% of products; Holland, China, Lithuania, Ukraine, Poland, Belarus, Japan. The average FOB price of product shipped at the end of 2017 was $ 1.80 per kilo. Majority of these products have been shipped on pallets in reefer vessels of 2-4,000 DWT, which load at the factories. Some of the factories are located up to 230 km from the nearest container port.
5.1.3 Aluminium
The 3 aluminium smelters in Iceland produce currently 870’ton a year. The smelter at Grundartangi ships 313’ton in containers on the service calling Rotterdam and Vlissingen, where Century Aluminium, owns a factory making 150’tons of anodes which are shipped to Grundartangi. Half of the production at Reydarfjordur is shipped in containers on the same vessels that carry the breakbulk half to Rotterdam and bring anodes from Norway on the return leg. The oldest of the smelters, making 212’ tons per year use dedicated vessels for their break bulk shipments, which carry some commercial containerized general cargo on the return leg.
5.1.4 Farmed fish
Export of fish farming products have taken off since 2009, mainly salmon and rainbow trout. Volumes are expected to grow to 40’ tons in 2020. Main growth in this industry will be in the Northwest of Iceland and has Samskip introduced weekly service to the heartland of fish farming in Iceland, Bildudalur. Another area for farming is not far from Reydarfjordur.
5.2 Greenland
Greenland, trades with Denmark on average for the last 5 years 215’tons, turned into 31’ teu, and additionally trades through Iceland 5% of the Danish volume, the number of teu will be 32,600, or 580 teu per 1,000 inhabitants. Significant part of Greenland´s pelagic catch is landed in Iceland for onward shipment to the market, and is therefore not included in the statistics.
5.3 The Faroes
The total volumes of unitized trade were in 2017 421’tons. 77% LoLo and 23% RoRo (78% of RoRo to and from Denmark), 1,186 teu per 1,000 inhabitants. Torshavn, the main port, is close to the main sailing routes between Reykjavik and Baltic, and the route between the east of Iceland to the UK and the Continent. Thereby the deviation for ships calling Torshavn on any of these routes is little. This explain the interest of the Competitors to conquer the neighbouring market. Also, the efforts by Smyril line in Torshavn to offer RoRo from Iceland to Rotterdam, calling Torshavn on the return leg.
5.4 The market and ballpark market share
Of the 427’ teu handled in Iceland, it is estimated that the Competitors carry 90% of the total, 383’ teu. The dedicated ships serving the smelters are believed to carry 44´teu. It is not known how this volume, 383’ teu is shared, but it is believed to be 2/3 for Eimskip and 1/3 for Samskip. The Faroes LoLo volumes is shared between Eimskip and Samskip. It can be assumed that Eimskip’s share is 75% +/- 10%, and Samskip has the balance. Eimskip and RAL have got exemption from Icelandic Competition Law ACT no. 44 for their Vessel Sharing Agreement until May 2024 subject to conditions requiring RAL to offer excess capacity to external parties and ban from having fixed prices and joint prices on surcharges. The combined capacity would be in excess of 70% based on the assessment above.
5.5 General development in the market with focus on Reykjavik
In 2005, port of Reykjavik merged with the port of Grundartangi, a port with a ferrosilicon factory and an aluminium smelter. Since then, Faxaflóahafnir is the official name of the organization. Grundartangi, which volume until 2005 is not included in the graph, contributes 11% of the containerized volume of the ports in 2017, is thereby the bulk of the growth.

Figure 2 Development of 3 indicators 1995 -2017 with focus on the port of Reykjavik.
5.6 North America Trade
More transit between Europe and America is contributing to the increase in number of teu in 2017 in Reykjavik. Eimskip operates three 698 teu ship on 4.870 nm service to Argentia and Halifax in Canada and Portland in Main in US which is Eimskip’s main port in US. It is estimated, that average weekly transhipment volume was approx. 350 teu. Attracting volumes to a port which is only couple of hundred miles from Boston, it is likely that the contribution to the Continental vessel cannot be high. There are regular services from North Europe to Halifax and from there domestic service to New Foundland.
5.7 Ports, ships, distances. A picture of the Iceland Europe services
In 2006 Theo Notteboom wrote: “The network planners may direct flows along paths that are optimal for the system, with the lowest cost for the entire network being achieved by indirect routing via hubs and the amalgamation of flows. However, the more efficient the network from the carrier’s point of view, the less convenient that network could be for shippers’ needs”.
While this may have partially applied to the operation of the two carriers in Iceland on the one hand and for the global container shipping on the other hand, the development since then has gone in opposite directions: The mergers, acquisitions, slow steaming, consortium and doubling of the size of the average container vessel operated by the largest 20 lines from 2,436 teu in 2006 to 5,163 teu in May 2017 and at the same time increase the total fleet capacity 2.8 times while the number of ships operated increased by 40%. In 2006 the Competitors operated 6 ships on 3 Europe routes calling Faeroes 1-2 times per roundtrip. 4 of the 6 ships are still in operation, two of them 23-year-old 1457 teu and two 909 teu from 2005.
5.8 Existing routes and ships.

Table 2 – The table is based on schedules of the Competitors, observation of movements of the vessels and on draught at departure from ports, using AIS data.
The information on details of the vessel’s, engine size, speed and consumption come from, owners, Alphaliner, MarineTraffic and various sources. Consumption at observed speed is calculated based on cube rule. Information about operation of three of the types above have been available for this article. In the table, the Sea Margin used is 34% based on actual data. The draught information from MarineTraffic is the only information used which is not automatic reading without manual intervention. The given draught is the maximum draught observed. To get the best use of the engine the trim matters. The optimal trim at various load condition is calculated in the ship’s documents, which are not in public domain.
At the end of September there were 6 services offered by The Competitors between Iceland and the Continent, calling Faroes on one (5-6) or both legs (1-2). The departures are focused on the fish-markets in the UK and on the Continent. There are 4 calls in Rotterdam per week and 4 calls in Aarhus, 3 on the same day. The Humber ports, Immingham and Hull, and Vestmannaeyjar restrict the size of vessels used. In Vestmannaeyjar the 900 teu vessels are the largest for the port, while ships around 1450 teu are the maximum for Humber ports.

Table 3 - The itinerary of the 6 services in September 2018
If the limitation of Vestmannaeyjar were not the obstacle, but access to Humber port the goal, the cost per slot would be only 74 % of the one restricted by the Vestmannaeyjar dimensions.
5.9 Humber-Max to gain competitive edge
Samskip, based on monitoring of reported draught at departure from Vestmannaeyjar compared with the competitor’s ship, doesn’t have equal marketshare to its competitor there. If they had the guts to go for the “Humber-max” vessel, they would have radically altered their cost performance and being able to sell at lower price to increase their marketshare.
6. Vertical Integration
The Competitors offer directly or through subsidiaries all the steps in the flow of goods from origin to destination. Abroad they are small fish in big ponds and compete with bigger players for the jobs. In Iceland and in the Faroes, they have unique position, selling the total package and have for that terminals, warehouses, trucking and forwarding outlets. They offer LCL service in competition with NVOCC´s/forwarders who have no other option than to use them.
In International Maritime Transport Cost (2014), Gordon Wilmsmeier argues that integration of door to door service and terminal operation into the same company through vertical integration would result in a lower transport cost than if three different companies handle the container along a transport chain. The basic concept is right, if applied in an economy where the customer has a choice, where there is competition. But when the terminal is owned by the container line in order to stave off competition, this is highly questionable.
6.1 Historical background
Eimskip was established as an alternative to foreign operators who were lacking roots and commitment to the community. The market was small, there were few intermediaries, customers dealt directly with the lines for documentation and on-carriage.
Due to containerization the service-pattern changed in Iceland. Instead of calling a number of ports around the country to load and discharge commodities for the local economy, which didn’t require special ships, the containerization concentrated the ships to Reykjavik and the imports and exports from the businesses on the coast were often carried by sea. As the roads improved, more and more were carried by road. The lines, then only two, gradually bought up a large share of the trucking capacity serving the country side.
The description above could be named as gradual and unintended vertical integration, which later became the main tool of concentration in the market.
6.2 Terminals in Reykjavik and around the coast
The port authority in Reykjavik has seen its role more as a supplier to few operators, and less as being responsible for access to transportation to Iceland, affecting the society as whole. The board of the port is manned by politicians with no known association or knowledge of ports or shipping, with multiple assignments in the municipality.
Each of the Competitors has their own terminal and gets away with claiming they need more land. The Port of Dublin, which has 3 independent terminal operators, has insisted on minimum turn of containers, doesn’t accept that the land in the port will be used for long term storage.
In an article published in Kjarninn in April 2018 it is maintained that a modern well-equipped terminal occupying 17 hectares (ha) for container yard and few ha for services, could accommodate the needs for the next 80 years based on turn of 26 or higher, assuming max throughput of 430’ teu. Greater throughput can be achieved with somewhat faster turn. This initiative would free up land of 25+ hectares for other gainful use in the periphery of the port.
A report from KPMG made for the port of Reykjavik in Oct 2018, confirms that as per international standards 30’ha will suffice for turnover of 600’ teu based on turn of 26. Common user terminal, open for competition, under clear performance criteria and prices reflecting cost, would contribute to economical transfer of goods in and out of the country. The concept of controlled natural monopoly as a way to run a terminal was presented.
6.2.1 Wharfage and THC
The Wharfage in Iceland is the highest known in North of Europe. It is based on commodities, not container units. In comparison to Oslo and Aarhus, the Wharfage is more than four times higher. The Wharfage ensures that the port of Reykjavik doesn’t need financial support from the government. The THC as presented in the lines’ charge sheets is on average 8 time higher than in Aarhus. It is 4,7 times higher than in Hamburg where the Wharfage is included in the THC. The modus operandi appears to have high official charges and give selective discounts.
6.3 Haulage
The lines operate their own trucking of containers. Fresh fish is transported from fishing ports around the country and is stored in preparation for shipping in a temperature-controlled space. Independent hauliers are struggling as they are competing on terms they can’t match.
6.3 Storage
Both the carriers have plenty of land and warehouses and offer storage in the yard and in warehouses. The competitors have for the last 27 years made efforts to sell warehousing and distribution services to customers as a separate service.
6.4 Independent International forwarders
The concept of freight forwarding was not common in the past. The Competitors have their own forwarding companies, appearing to be independent like Damco at Maersk. Eimskip has especially invested in temperature-controlled forwarding on the continent. Schenker has established presence in the market as the first truly independent international forwarder.
6.5 Faroes and Aarhus
77% of the unitized trade is LoLo and carried by the Competitors. Eimskip bought the local carrier Faroe ship in 2004. Their ships had 6 calls a week in Torshavn where they have an MHC, own warehousing, distribution and trucking service identical in all but size to the one in Reykjavik. Close to 50% of the Faroes trade is through Aarhus by LoLo where Eimskip have their own warehouse, and replication of their services in Reykjavik and Torshavn. Samskip had limited presence in Faroes, with weekly westbound call which by default was limited to imports to Faroes. They have since included Faroes in the coastal-continental service.
6.6 Greenland
On 3rd of June 2015 the parliament of Greenland, agreed to separate the port operation in Nuuk from the state-owned shipping line, Royal Arctic Line, (RAL), by establishing a new port company SIKUKI NUUK HARBOUR and build a new container terminal in the capital, Nuuk. SIKUKI took over the operation of the port on 1st July 2016. Nuuk port is now a tool port. Haulage is the only area of shipping related business RAL is not involved in, and at least 3 haulage companies compete for business.
7. The actions in the market
The market, discussed here, consists of many importers and exporters. No survey has been conducted of their specific preferences, but there is abundance of surveys globally. The preference indicated in selection of carriers is based on reliability and cost-efficient service. The lines have made many attempts to differentiate their service, higher quality/ reliability against higher rates, which until now have mostly failed. The most famous was Daily Maersk.
In the market covered by this article, it is likely that the customers who get the most service, do so often at the cost of others who get lesser service. The market is close to a zero-sum game, the volumes will not increase if the services are changed, but the selection of carrier especially for new customers could be based on the extras. If there is a significant reduction in cost of transporting containers, break bulk goods, like the pelagic fish could be containerized.
7.1 Competition from RoRo in Thorlakshofn
In April 2017 Smyril Line, commenced RoRo service between Thorlakshofn and Rotterdam using Mykines, built in 1996 as a car carrier, able to carry 90 trailers and 500 cars. Thorlakshofn is a port 50 km from Reykjavik, some 87 nautical miles closer to Rotterdam than Reykjavik. The service offers the shortest transit time to the fish markets on the continent, 64 hours, departing late Friday night. The ship arrives Monday afternoon so the fish can be available for consumers on Tuesday morning. Concept-wise, the service is similar to the Irish Land-bridge. Annual volume is approx. 2% of the unitized trade in the Icelandic market.
Mykines average speed is 16.7 knots. Estimated consumption per roundtrip is 268 ton. Mykines has capacity in trailers volume equal to 202 teu and in rolling material equal to 225 teu. Fuel consumption per calculated slot per leg is 315 kg. Consumption per slot on the four 900 teu ships deployed in the Icelandic trade is 130 kg per leg. It is likely that other cost is in line with the 900 teu ships, indicating that the cost of Mykines, apart from fuel is two times higher per slot than for the 900 teu ship. The calculated cost of the ship per slot is more than two times the alternative, which could be justified by the shorter transit time. The port in Thorlakshofn can only accommodate ships with maximum length of 170 m, 30 meters longer than Mykines. A ship with more capacity and same speed and similar running cost could make a difference.
In the last quarter of 2018 both the Competitors amended their routes with increased focus on quick service to Rotterdam. Eimskip’s, 1457 teu vessel leaves Reykjavik Thursday night and instead of calling Reydarfjordur and Torshavn the course is set on Rotterdam to arrive 3 days later. Samskip’s 908 teu vessels leaves Reykjavik on Wednesdays night, calls Vestmannaeyjar, and Kollafjordur and arrives in Rotterdam on Sunday.
Will this kill Mykines? It is quite possible that some of those who might have valued much shorter transit time to Rotterdam for a premium, now are content with a day longer transit time with Eimskip for less. Eimskip has a long history of eliminating competition often through a directed price war and in the end buy the ship to sell off soon afterwards.
7.2 Bildudalur
Samskip has secured business for fish farming in the Northwest of Iceland, Bildudalur, where a ship will deliver supplies and load products on weekly basis. Previously, the supplies and products, were trucked to the port of loading. The current volumes are 10-16 40’RF and might treble in next few years. The ship continues through Reykjavik to UK and the continent. Two 698 teu ships have been added to the fleet while discontinuing with one 505 teu.
Bildudalur is 150 nm from Reykjavik. The fuel consumption is 15 ton. If the volume of 15 40’RF had been carried by 13 trailers, 420 km each leg, the fuel consumption is 5 ton. Samskip’s new setup leads to higher cost for the system. The fish farming business at Bíldudalur might not pay for this. The cost could be spread among all the users in one way or another, unless Samskip manages to increase marketshare and thereby get acceptable utilization for expanded fleet. Which leads to lower utilization by the competitor.
8. Not so unlikely option
The volumes in the trade described may be of interest to the big lines, like CMA CGM who have been investing in intra-European multimodal transport. Samskip which is privately owned would be a likely takeover target as Eimskip’s share of the market is so dominating. Important part of the acquisition would be the terminal in Reykjavik. Undoubtedly such acquisition would change the mentality in the market, as the goal will be profit, not trophies!
9 To do things differently and save fuel
The services at the end of September were presented in table 4. and 5. It is possible to replace the first table where 6 services with 12 ships using 74’ ton of fuel per year with another table 6, with 3 services calling the same ports (with few exceptions) and using 37’tons of fuel.

Table 4. – A network giving the same utility with much less fuel consumption.
9.1 Three main services
The setup presented in the table is based on having two main services where the size of the ship will cater for the volumes of the two markets, the Continent and the Scandinavian markets.
9.1.1. The Rotterdam Route
This is to some extent a replica of the 1457 teu service at lower speed due to less distances and relatively less time in port. Reykjavik, Grundartangi, Torshavn, Vlissingen, Rotterdam, Bremerhaven, Torshavn, Reykjavik, 3.000 nm. The type of ship intended for this operation is SDARI 2500, similar to the ships CMA-CGM operates in the Baltic, 2487 teu Pregolia and Neva. They call 5 ports and travel 2,540 nm every two weeks, with average draught on departure of 10.3 m which is approx. 29,000 DWT. The assessment of fuel consumption indicates that at design draught the fuel consumption per teu slot will be 77 kg. It is based on Design draught; which DWT is 47 % greater than the 1457 teu vessel currently on the route.
9.1.2. The Aarhus Route
The ships considered for this route are of Topaz 1700 Type. The proposal is to have alternative routes each week. One includes calling 3 ports on the coast in Iceland, Isafjordur, Husavik and Reydarfjordur, Torshavn, Aarhus, Helsingborg, Torshavn and Reykjavik, 2.993 nm. The Baltic alternative is Reykjavik, Reydarfjordur, Torshavn, Aarhus, and then the choice is to go to Fredrikstad and from there to Helsingborg, Aarhus, Torshavn and Reykjavik, 3.071 nm.
9.1.3. Immingham route
Reykjavik, Vestmannaeyjar, Torshavn, Immingham, Torshavn, Scrabster, Immingham, Reykjavik, 3.340 nm.
9.2 On- and Pre-Carriage
In their work: Port Regionalization; Towards a New Phase in Port Development, 2005 Notteboom and Rodrigue estimate that pre and post carriage of containers on land cost 40-80% of the total transport cost from the shipper to the consignee.
If in Iceland the shippers get the ship to call port close to their doors for export and imports, the cost of the first or the last miles will not be for their account but being largely shared by other buyers of services from the shipping companies, unless the freight cost to and from coastal ports reflects the extra cost, which is rather unlikely in the current market situation.
9.3 Competition in its many forms
Opaque price structure and several expensive surcharges opens for giving a customer with significant recurring volumes discount, offer storage, discounted transport etc. Having calls to ports where the volumes do not justify calls, without charging the benefitting customers, is an incentive which can be costly to the line. Same applies when, to please the customer, the departure of the ship is delayed for hours to accommodate few late boxes.
10. Alternative solution
The fresh fish dictates the departures close to the end of the week. The tendency to have some ships to arrive early in the week and leave late in the week results in excessive time spent in port in Reykjavik. The average time of the ships on main services was in Reykjavik 81.5 hours, 63.5 hours and 47.5 hours in 2017. Turnaround of ships of this size in a well-equipped terminal should be less than 30 hours. There is a solution, which is to have 4 identical ships which alternate on the longer and the shorter route. When ship returns from the short route it loads and leaves for the long route, which then returns later and then takes the short route. This leads to early arrival from sources of imports and optimum time in port and lowest possible fuel use.
10.1 There is a need for change
In this article, the negative effects of competition between uneven parties has been explored. The absence of governmental policy on competition in transport and uncritical support of the board of directors of the port of Reykjavik has contributed to cementing the described situation which has led to waste of resources, fuel, ships, land and manpower.
In 2M alliance the market share of the two partners is similar, and they are competing with 2 other alliances. An alliance between Eimskip and Samskip would be unlikely due to uneven marketshare and longstanding hostility and total lack of cooperation.
Sea transport, especially containers, where barrier of entry is high, is like the bridge between Sweden and Denmark, available to all for use for a known cost. The term Container transport as an infrastructure was coined by Professor Johan Voxenius in a discussion during IAME conference in Mombasa 2018.
10.2 The concept
On the main shipping routes to and from the country, most likely with the inclusion of the Faeroes, possibly Greenland, would be run by an entity tasked with operating the ships, here presented as 3 routes with 6 ships, but that should not be taken as the only way or the right way, just a concept to get the discussion going. The operation should be based on cost recovery within known rules which considers imbalance in trade and seasonal variations in volumes. Space is sold according to rules to what is called here forwarders (retailers). The common user terminal in Reykjavik must have a clear performance requirement where the service is sold at cost, without discrimination. The terminal should be under different ownership/ management than the entity; which should generally not be allowed to operate outside their core activity.
The Competitors would be first in line to act as forwarders and then international shipping companies and forwarders. The forwarders will be free to offer whatever service inclusive of on- and pre-carriage, warehousing and documentation. There should be as little discrimination as possible and based on policy in public domain. The power to dominate the market would be much less than in the current settings and would lead to competition for providing services worth around half of the total door to door cost. The objective is that the customer has a real choice benefitting from economies of scale on the sea leg, productivity in terminal operation, and competition among equals (almost) for managing the flow of goods through ships and terminals, where the threshold to entry is relatively low and in carried out by asset light entities.
This concept is not entirely alien, the alliances provide sea transport with containers provided by the contracted line. Ships call terminals which most are run as entities with known prices and performance goals. The on and pre-carriage can be arranged by whomever, but most often by large forwarders or the contracting lines or mix of both.
11. Conclusion
In the absence of recent information of actual price of transportation, this article goes beyond statements by the most influential lobby in Iceland, Fisheries in Iceland, which maintains that high cost of shipping, higher than what producer in Norway have to pay, threatens the competitiveness of seafood from Iceland, and analyses of the cost of providing the service and uses the quantity of fuel as key to asses an alternative solution.
Attempt has been made to explain cost elements in operation of ships and building the case for halving the use of fuel is realistic.
The conclusion is that the duopoly of uneven participants fighting to maintain their market share by stretching the service to larger customers and endeavour to exclude all serious competitions, is not desirable. These efforts are helped by absence of laws which make it mandatory for ports to ensures active competition, thereby access for new entrants on equal footing with the existing users.
The negative consequences for the Icelandic society of the competition as described above is not only the volume of extra fuel used, and consequently GHG effects, or employing 6 extra ships, or taking up 25 ha of land to block new entrants in the best part of Reykjavik, all of it we can describe as waste, but the notion that the Icelandic economy, especially export, doesn’t have access to transport cost equal to competitors in neighbouring countries, hurts and negatively affects growth in critical industries.
The solutions are proposed to open the dialogue, are not aimed at restricting competition but to ensure that the most economical operation leads to real cost reduction for importers and exporters, and less use of oil. The operation should not fight with other means than excellence in providing cost-effective, reliable service fitting most users. By drawing lessons from Ireland, the ferries serving Iceland have a role in getting the products faster to the market and offer solution for rolling cargo, and their operation shouldn’t be crushed by temporary modification of itineraries by the competitors.
It is hoped that this article, with its shortcomings, will encourage further research and discussion contributing to more efficient logistics for the islands in the North.
References:
Allied Weekly Market Report, week 5 2019, Allied Shipbroking, Athens, Greece.
Alphaliner Weekly Newsletter, issues 05 2019 and 09 2019.
Brooks, M. R., 2000, Sea Change in Liner Shipping, Emerald Group Publishing, UK.
Cariou P. et al, 2018, Towards low carbon global supply chains: a multi trade analysis of CO2 emission reductions in container shipping, Presentation at the IAME conference in Mombasa.
Coyle J.C. et al, 2006, Transportation 6e, Thomson South -Western
Christodoulou A. et al, 2018, The integration of RoRo shipping in sustainable intermodal transport chains: the case of a North European RoRo service, Presentation at IAME 2018 in Mombasa.
The Competition Authority Ireland, 2013, Competition in the Irish Port Sector.
DFDS Annual Report, 2017, Copenhagen, 2018.
Drewry 1994, report, Íslenski gámamarkaðurinn í alþjóðlegu samhengi, Félag íslenskra stórkaupmanna (The Icelandic container market in international context).
Drewry 2017, Two steps away from liner paradise? Spotlight report. https://www.drewry.co.uk/news/news/is-the-liner-shipping-industry-just-two-steps-from-paradise .
Drewry 2018, Ship Operating Cost 2018 Trends, Webinar recorded 200218.
Eimskipafélag Íslands hf. 2017, Consolidated Financial Statements for the year ended 31 December 2017.
EU, 2008, Guidelines on the application of Article 81 of the EC Treaty to maritime transport services (2008/C 245/02).
Friedman, James W, Duopoly 1989, In: Gametheory, Palgrave 1989.
Haralambides, H.E. 2019, Gigantism in container shipping, ports and global logistics: a time‑lapse into the future, Maritime Economics & Logistics, (21) pp 1-63.
Haralambides H.E. et al 2003, “THE ERASMUS REPORT”: GLOBAL LOGISTICS AND THE FUTURE OF LINER SHIPPING CONFERENCES Rotterdam, 2003.
Heaver T. D. 2002, The Evolving Roles of Shipping Lines in International Logistics, International Journal of Maritime Economics, 2001, 4, (210-230).
Hirata E. 2017, Contestability of Container Liner Shipping Market in Alliance Era, The Asian Journal of Shipping and Logistics 33 (1) 2017.
Hermannsson, P., 2018, “COSTCO en ekki COSCO”, Kjarninn, https://kjarninn.is/skodun/2018-04-11-costco-en-ekki-cosco/
International Transport Forum, 2018, THE IMPACT OF ALLIANCES IN CONTAINER SHIPPING.
Irish Maritime Economist, 2016, Volume 14, Irish Maritime Development Office, Dublin.
Irish Maritime Economist, 2018, Volume 16, Irish Maritime Development Office, Dublin.
Knowler, G., 2019, Capacity cuts keeping Asia-Europe rates afloat, https://www.joc.com/maritime-news/capacity-cuts-keeping-asia-europe-rates-afloat_20190415.html .
KPMG Iceland, Report 2018, Sundahöfn Starfsumhverfi og breytingar til framtíðar.
Kronbak J. et al, 2017 Omkostninger i Godstransportkæder, DTU, Denmark.
Magnusson G., 2014, Eimskipafélag Íslands í 100 ár, Saga félagsins, Eimskipafélag Íslands, Reykjavik.
Magnusson H., 1986, Hafskip, gjörningar og gæsluvarðhald. Frjálst Framtak, Reykjavik.
MAN Diesel & Turbo, 2011, Basic Principles of Ship Propulsion, Copenhagen.
Marteinsdottir, H. L., 2019, Samkeppnishæfni sjávarútvegsins og 98%, Morgunblaðið 180119, Reykjavik.
Ministry of Transport Iceland, 2003, Skýrsla nefndar um flutningskostnað.
Ministry of Transport Iceland, 2004, Greinargerð um breytingar á flutningum innanlands.
Notteboom, T., Rodrigue J-P., 2005, Port Regionalization; Towards a New Phase in Port Development MARITIME POLICY AND MANAGEMENT, VOL. 32, NO. 3, PP. 297-313.
NOTTEBOOM, T., 2006, The Time Factor in Liner Shipping Services, Maritime Economics & Logistics, 2006, 8, (19–39).
RUV, 2018 http://www.ruv.is/frett/gamar-af-laxi-med-aaetlunarskipi-fra-bildudal#slideshow-1.
Santos T.A. and Soares C G., 2017, Methodology for ro-ro ship and fleet sizing with application to short sea shipping, Maritime Policy and Management.
Stopford M., 2009, Maritime Economics, 3rd Edition, Routledge 2009.
Szelangiewicz T. and Żelazny K., 2016, Ship service speeds and sea margins, Scientific Journals of the Maritime University of Szczecin, 48 (120), 43–50, ISSN 1733-8670.
Sys Christa, 2010, Inside the box: assessing the competitive conditions, the concentration and the market structure of the container liner shipping industry, Dissertation, University of Antwerp.
Yee Shin Khor et al, 2013, Optimum speed analysis for large containerships. In: Transactions - Society of Naval Architects and Marine Engineers.
Vaneslander, T. 2001, Competition in ports and services, In: COMPETITION IN PORTS AND PORT SERVICES OECD.org, DAF/COMP (2011) 14.
Wilmsmeier G. 2014, International Maritime Transport Costs, Ashgate England, 2014.
Vega, Amaya et al, 2018, The potential impact of Brexit on Ireland's demand for shipping services to continental Europe, Transport Policy 71 (2018) 1-13.
[1] https://commons.wikimedia.org/wiki/Category:Ships_built_at_Sietas_Werft