
Competition in the North Atlantic
How might the cooperation between RAL and Eimskip affect Greenland
The introduction of cooperation between RAL and Eimskip has been short on details. Sea-transport, a very important topic, does not get much attention in the media, neither in Greenland nor in Iceland. The headlines are complaints over service and or cost, at times unsubstantiated, or “Good News” from the lines which are so thin on detail that they don’t quell the noise of those not at ease.
It is known that transportation, especially development of sea transportation, has had a major impact on prosperity in modern societies. Therefore, it is imperative that main elements of transportation are well understood, especially by the business community. If not, the society might be deprived of valuable opportunities.
This article is written due to the author’s curiosity of the subject and might be a contribution to informed discussion about transportation in the North Atlantic, with focus on competition
In the North Atlantic, there are 3 island states, which soon will share the same transportation system offered by Eimskip, partnering with Royal Arctic Line in Greenland, a company wholly owned by the government of Greenland, and Faroe Ships mostly owned by Eimskip, if the cooperation is approved by the competition authority.
The countries are Greenland with a population of 56’, Iceland with population of 332’ and Faeroe Island with 48’ inhabitants.
These countries are mainly trading with North Europe or through North-European ports.
There are two privately owned shipping companies In Iceland, one with roughly a third of the general market, Samskip, and the other, two third, Eimskip. There are other players offering bulk services to the industries, volume wise mostly to aluminium and other smelters, raw materials and finished products. One of those is carrying aluminium for 2 of the 3 smelters, there of just under 200´tons in containers, which is 20% of the export market in weight. RoPax service from the east coast through Torshavn to Hirtshals and recently roro service, between Thorlakshofn, a port on the south coast and Rotterdam, calling Torshavn on the leg to Iceland.
Significant volume of frozen products is carried in reefer vessels, mainly pelagic fish, and largely directly to the markets, often without transhipments.
RAL, Royal Arctic Line has a monopoly on the trade to and from Greenland. A significant part of the Greenland pelagic catch is landed in Iceland and shipped from Iceland to the markets in the same manner as the Icelandic catch (Bulk vessels).
Eimskip and RAL have notified of their intention to run a system of three 2.150 TEU ships, said to have DWT of 30.000. These ships would replace the Atlantic fleet of RAL, two 22-year-old ships, 782 TEU´s, 9.556 deadweight tons (DWT) specially made for Greenlandic ports, and replace two ships of Eimskip of same age. Each 1.457 TEU, 17.034 DWT.
Eimskip and Samskip have had a duopoly in the Icelandic marked, which most likely will be affected as the increased scale effects Eimskip gains out of the cooperation, reduces their unit cost.
This article is part of wider study on the competition in the North Atlantic and is mainly intended to analyse the cost and operational effects of the cooperation, and then glance at the future competition i.e. what options are freight buyers likely to have in the future.
Distances and speed
This chapter will look at the distances and speed of ships trading between Nuuk and Alborg, at times calling Reykjavik, mainly on the leg back to Nuuk.
The RAL ships are Naja Arctica, Nuka Arctica and Malik Arctica, Mary Arctica. They are all specially built for RAL and are intended not only for Aalborg - Nuuk trade but also for coastal trade in Greenland.
Main particulars
| Length | Breadth | TEU | speed | Consumption t/24 h |
|
| Naja/ Nuka | 133 | 24 | 782 | 16,5 | 31 |
| Mary/Malik | 113/114 | 22,7 | 572/606 | 15,3 | 34 (Mary) |
Distances as registered by Marine Traffic are used for each leg. The distances the ship travel on the same leg varies due to weather. Except in the worst of weathers the variations are limited.
For Greenland trade, the information is based on RAL’s 3 ships, all or part of 88 legs between Nuuk and Aalborg and data on legs between Nuuk and Reykjavik and Reykjavik and Aalborg.
The average distance between Nuuk and Aalborg is 2.230 Nautical Miles (nml).
The average speed for the RAL voyages monitored was 14,2 miles per hour, which translates into 157 hours each leg, 6 days, 13 hours. The longest time it took was 192 hours in the first quarter of the year.
Approximately every 3rd return leg from Aalborg is via Reykjavik. The distance Nuuk - Reykjavik is 1.082 nml and it took on average 3 days and 9 hours to cover this distance at a speed of 13.7 knots (26 observations). The longest time this leg took was 4 days and 1 hour.
The distance from Aalborg to Reykjavik is 1.230 miles and on average this was completed in 90 hours at a speed of 13,7 knots. The longest time it took was 4,5 days in the first quarter of the year.
As a reference, the “ocean” part of Iceland/Faeroes/UK/Continent/Scandinavian voyages of pair of sister ships Arnarfell and Helgafell and Lagarfoss and Bakkafoss is used.
| Length | Breadth | TEU | speed | Consumption t/24 h |
|
| Arnarfell | 137,5 | 21,3 | 908 | 18 | 37 |
| Lagarfoss | 140,7 | 23,2 | 880 | 18.3 | 37 |
The ocean legs are to and from Reykjavik and first port in UK (Immingham) and last port in Scandinavia, Varberg/Aarhus, where on the outbound leg the ships call Vestmannaeyjar and on the return leg Kollafjordur/Torshavn. The two services monitored differ in intensity of miles covered.
One service includes sailing 3.070 miles in 14-day round trip thereof passing the Kiel canal, where the speed is restricted, and it takes time to pass the locks. The average speed is 15 knots. In 5% of instances the ship sailed at speed of 17 knots or higher, probably to catch up, due to delays in port or unfavourable weather.
The other service covers fewer ports and only between 2,610 and 2740 miles per 14 days. In 13% of observed legs, the speed was 16 knots or higher, mainly on the southbound legs to reach markets in UK. The average speed is 14.6 knots which leads to a fuel consumption which is approximately 70% of the maximum speed.
It can be maintained that all the vessels mentioned are trading in similar waters. The same applies to the last leg to and from Nuuk, while the average speed of the RAL vessel calling Reykjavik on its sailing between Aalborg and Nuuk is the same on both legs from Aalborg and from Reykjavik.
Volumes

Figure 1 Containerized goods shipped from European Ports to Iceland 2006-2015. Based on Eurostat
The intention of this section is to give insight into the rather limited statistics available. It gives indications only.
The information is largely based on Port-data from Eurostat. The information given is in thousands of tons of Containerized Goods. In absence of exact data, it can be assumed that on average each TEU contains 10 tons of goods, but it is likely that exports are denser, more weight per TEU and imports may not reach 10 tons. In general, the more processed goods are, more volume to weight.

Figure 2 Container transport to Iceland from the Icelandic fleet main ports of call in Europe 2006 - 2015
Eurostat has data on sea freight to and from Iceland, Faroes, Greenland, and European ports, but not on any other continent as this is based on port statistics in Europe, where Iceland doesn’t contribute and probably not the Faeroes either.
Iceland
In the last 10 years, imports are virtually the same at the beginning and at the end of the period; in 2006, 916´tons and in 2015 935´tons. Maximum in the year 2013, 1.119´ tons and minimum of 449´ton in 2009.
Rotterdam is by far the largest port, both in imports (66%) and exports (79%) on average throughout the period. The supplies to and products from the smelters (aluminium and alloy) explain large part of this statistics but increasingly Rotterdam is used for transhipping other goods to and from Iceland.
For whatever reason, the information from Swedish ports is incomplete and therefore the entry is extrapolated based on information from one port. As transportation between Iceland and Sweden are relatively modest, eventual error will not affect the total picture significantly.

Figure 3 Export from Iceland to main ports of call in Europe 2006 – 2015
Containerized export was not affected by the banking crisis and is more stable. The greatest export volumes were in 2011 (1,180´tons) and the lowest in 2006 (665´tons), with the average of 1.014 tons.

Figure 4 Import and export to Rotterdam 2006 - 2015
Rotterdam is the only foreign port where significant part of the goods is not transported in containers, but in bulk vessels.
The assumption is that most of the goods to Iceland is raw material for Aluminium smelters to Iceland and finished product from Iceland .
One out of three smelters in Iceland is mainly using breakbulk for their exports, another has a 50/50 mix of breakbulk and containers and the third is mostly containerized.
Iceland exported 855.690 tons of aluminium products in 2016.
Faroes

Table 1 Estimate of container volumes between Faeroes and Iceland
As neither Iceland nor the Faroes contribute their own date to the Eurostat database, the information on transport between Iceland and the Faroes is based on Icelandic trade statistics, which doesn’t differentiate based on mode of transport. There is a weekly RoPax ferry between Seydisfjordur in Eastern Iceland and Torshavn, which returns in Hirtshals.
In this compilation, the assumption is that the ferry has a 30% of the trade, therefore the containerized transport between Faeroes and Iceland would be as in the table above.
As this study is about containerized transportation services between Iceland, Faroes and Greenland to mainly European ports, where the focus is on the country with the greatest population and 2 active shipping companies competing for the business.
During the period, the volume transported in containers between European ports and Faeroes has grown steadily from 97´tons in 2006 to 247´tons in 2015.

Figure 5 Containers from Faeroes to European ports served by Icelandic carriers 2006 -2015
The main trading port is Aarhus which has on average 41% of the containerized export from Faroes in this report, while Rotterdam has 33% %, Immingham 22% and Hamburg 4%
The import to the Faroes is more concentrated as containerized imports from Aarhus are 87% of the total, Rotterdam has 11%, Immingham and German ports have the rest.
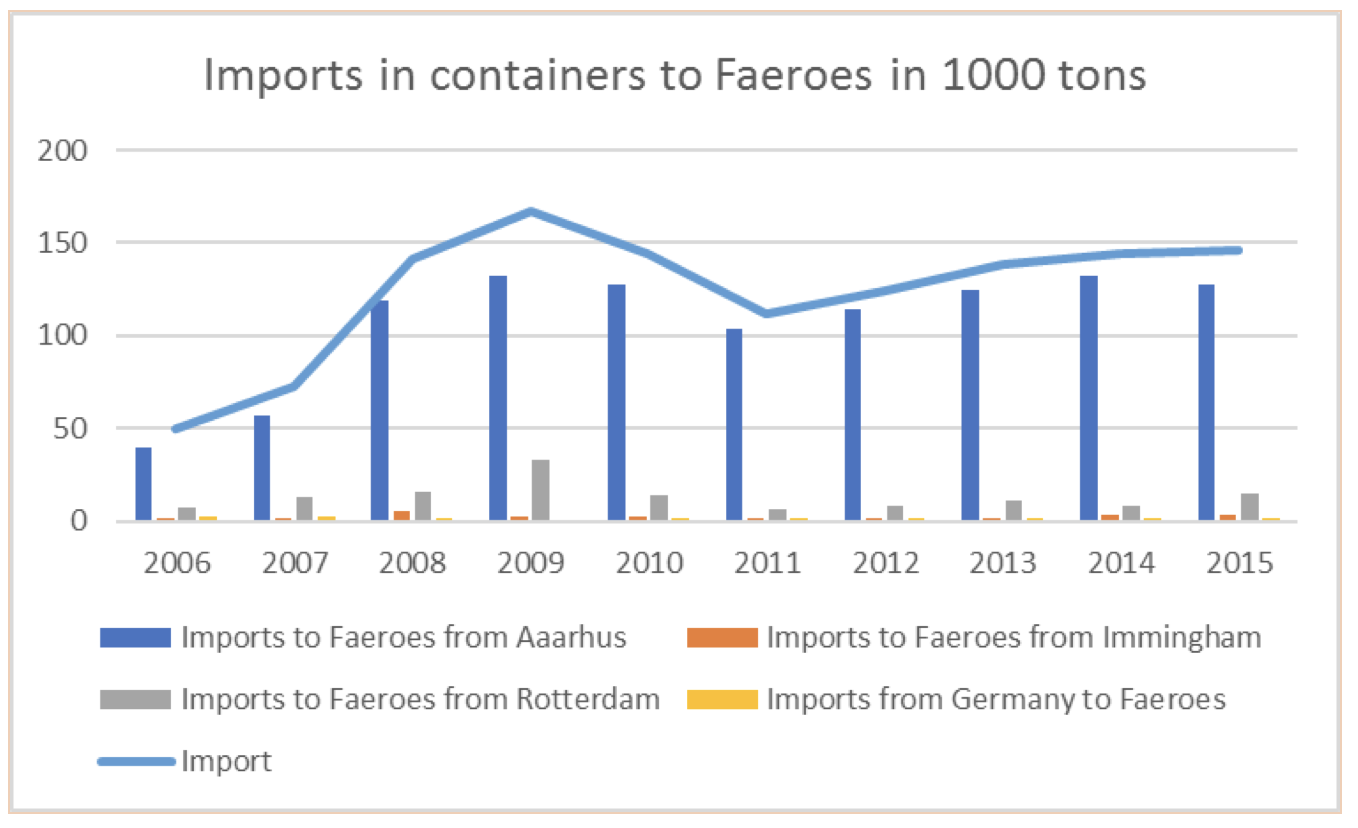
Figure 6 Imports to Faeroes 2006 - 2015 from ports called by the icelandic fleet
In Eimskip’s Annual Report for 2016 the CEO made the following statement regarding new cooperation between Eimskip and RAL: The intention is also to connect Greenland better with the rest of the world and to share capacity. This will allow for growth in business between Iceland, Greenland and the Faroe Islands, allow Greenland to have more variety in sourcing imports and enable its exporters to export directly to other Scandinavian countries instead of exclusively to Denmark.
The lesson from the Faeroes is that the imports stay with Aarhus while the export is spread mainly between Aarhus, Rotterdam and Immingham, where it may be assumed that the on-carriage to other European countries and Asia will be through Rotterdam.
As the service between Iceland and Europe is the same as the one serving Faeroes, the capacity used is shared.
In 2015, the volume of containerized goods from Iceland to European ports was 900 thousand tons. The volume from Faeroes is 101 thousand tons. Volumes on the RoPax ferry Norrona is not included in the statistics.
The imports to Iceland were 935 thousand tons and to Faroes were 146 thousand tons.
The annual base TEU capacity must take into account 1081 thousand tons + capacity for seasonal variations.
As mentioned earlier, Iceland has no transport statistics on its own, and ports except for Reykjavik and Hafnarfjordur don’t issue any statistics. Reykjavik reports annual volumes, while the Port of Hafnarfjordur port presents a month wise breakdown of the previous year in the minutes of their annual board meeting.
Using trade statistics
It has not been possible to gauge the monthly fluctuation in volumes and will only be possible through use of the trade statistics, where one should assume the certain products are containerized and others are in bulk. This is an indication; however, it is far from being the right material for drawing a definitive conclusion.

Table 2 Quick view on the busiest months of the year in imports to Iceland 1999 -2016 (blue shade) and the least busy for the same period (brownish shade) base on Icelandic trade statistic for selected commodities
The average of each month’s imports in the period 1999-2016 indicates that there is very limited fluctuation between the months, the one with the largest volumes has 1,2 times the average volumes, while looking at each year, the outcome is different, at the worst 1,8 times the average, once, 3 times 1,7 times. In the last 3-4 years, the fluctuations between months are less.
Generally, the first four months of the year see the largest volumes, April has most frequently the largest volumes, July to September and December have lower volumes.
This statistic is based on weight where certain products, say building material, are more likely to be imported in the spring and therefore this might not give the true picture of the containers used.
As commodities in export are alternatively containerised or in bulk it is not possible to draw conclusions based on trade data.
Nuuk

Figure 7 Movement of containerized goods between Greenland and Aalborg 2007 - 2016 based on Eurostat
Eurostat reports Greenlandic exports and imports in containers via Aalborg, where the trend in imports is declining while the exports have also declined but not to the same extent.
One might ask whether Iceland had picked up any of the trade lost between Greenland and Aalborg.
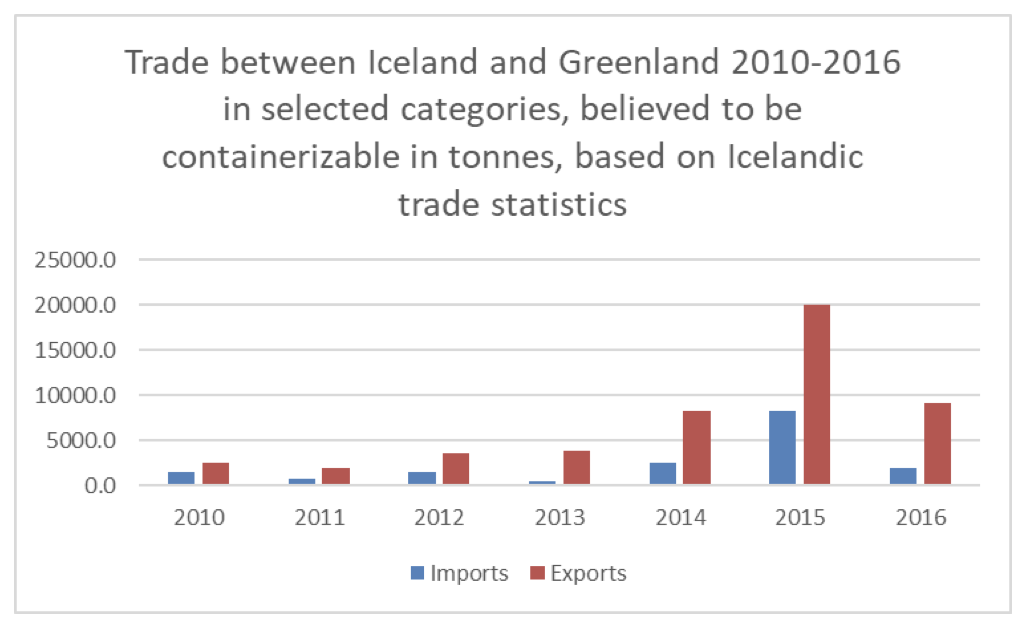
Figure 8 Trade between Iceland and Greenland 2010 - 2016 in tons based on Icelandic trade statistics
Icelandic statistics for commodities believed to be containerized show some increase both in imports and exports, but they are far from substituting the lost volumes through Aalborg. It is worth stating here, that the 2 sets of statistics are not compatible, and the Icelandic input is just to gauge whether there is a significant trend.
RAL reports volumes in m³ where most others involved in container transportation report volumes in TEU’s/ tonnes.

Figure 9 Volume of goods shipped on Royal Artic Line´s vessels 2010 - 2015 measured in cubic meters. The lighter shade of grey is exports from Greenland and the darker import. From RAL´s annual report.
Inbound volumes have been hovering around 400.000 m³ which could translate into 20.000 loaded TEU’s and 300.000 m³ exports which could translate into 15-20.000’ loaded TEU’s. Significant part of exports are prawns where a 40´ container contains 19,8 tonnes. It can be assumed that approximately 25% of the containers being transported are empties.
Bearing in mind the lack of proper tools to compare, we can still assume that there are similarities between the volume of the Faeroe trade and the Greenland trade in general. The caveat is that all the trade to and from Greenland is carried by RAL, while significant part of the catch of the Greenlandic trawler fleet is landed in Iceland and some in Denmark and are not shown in transport stats.
There are great seasonal variations with the first quarter with significant lower volumes than the rest of the year.
The trend in m³ inbound and outbound has been stagnated at best during the last 10-12 years but generally rather on the decline. When there are big projects going on, the volumes go up during the construction period but fall back to normal again. In 2015, there were significant volumes due to construction of the new SIKUKI container terminal and the new prison.
Reykjavik
Reykjavik is the main port of Iceland for containers. The coastal calls were abandoned for approx. 10 years and the goods was trucked to and from all main towns, excepti to one port, Reydarfjordur, which has throughout the period had a weekly main service call, and Vestmannaeyjar where both lines call weekly. Both the carriers have now weekly calls on the coast with direct connection to the continent. Despite the difference in market share, Eimskip 2/3, Samskip 1/3, they use sister vessels on this trade, build between 2000 and 2003 having a dwt of 5500 and capacity for 505 TEUs

Figure 10 Full TEU´s handled in the Ports of Reykjavik 2005 - 2016 compared with the population in Iceland during the same period. Based on Faxa Port and Icelandic Census
The graph shows slow but steady growth of population while the number of TEUs fell after the end of the boom years of 2008. The volume is growing again fuelled by increased purchasing power of the population and investment in cars and other goods needed for the fast-growing number of tourists. If the average tourist stays 3,6 days in Iceland, the consumption of the 1,2 million visitors in 2015 equals population of 12.000 which is 3.5% of the total population. The estimate for 2017 is 2,4 million which then should lead to increased consumption and in the meantime considerable imports to for the new hotels to accommodate the tourists.
In 2005 there were 5.454 TEUs loaded at Grundartangi growing to 13.062 TEUs in 2009 which is the last year volumes through Grundartangi were reported separately. It can be assumed that in 2017 there are at least 15´ TEUs loaded in Grundartangi and 6´ discharged. Without the smelter volumes, the throughput in Reykjavik (inclusive Grundartangi) would be 10% less than it is today.
When a ship leaves Reykjavik, 50% of the containers are empty. Of all containers handled 32% are empties. Some of them might be filled in Vestmannaeyjar or Reyðarfjörður or on the coastal service, so when a ship leaves the last port, the ratio might be different.
The new services by Eimskip and Samskip have also somewhat contributed to less volume being handled in Reykjavik; however, this is very difficult to quantify.
The planned combined service of RAL and Eimskip ties into the flow through Reykjavik.
Iceland export approx. 970’ ton of aluminium and metal products. Approx. 450’ of this is carried in containers while the balance 520’ tons is carried in break bulk vessels.
There are 2 potential growth industries in terms of export and subsequently imports, fish farming and silicon metal factories. Both the initiatives meet resistance due to environmental issues and the smelters have faced challenges in funding the projects. The smelter in Keflavik has temporarily been closed, but it had initial production target of 23´ton per year. The forecast for Keflavik was as high as 90´tons. A factory in Husavik in the North of Iceland will start production 2018 with annual output of 32´ton to grow to 66´ tons per year. Plans for a factory at Grundartangi has been shelved due to lack of funding, where the target was approx. 20´ton per year.
All these facilities were to produce containerizable volumes which might affect the balance in Icelandic trade.
The volumes mentioned in fish farming are in the region of 70´-130´tons, which is a considerable addition to the shipping market if they materialize.
Seafood, the main export, is partially carried in container (especially the demersal catch, e.g. cod), while products are increasingly being airfreighted. The lower value pelagic fish is largely carried in reefer vessels.
In the spring of 2017 6 ships with in total capacity of 4.954 TEU’s depart from Reykjavik every week in which all call additional ports in Iceland before heading for UK and the Continent. This is 30% more capacity than in 2014.
This does not include the N-America service.
The reason for the increased capacity is unknown. Same applies to the utilization. Some of the capacity might be misplaced. In Eimskip’s half-year report (2017), the CEO explained that part of the 43.6% reduction in profit compared with H1 2016 is due to increased capacity of the fleet.
The sailing schedules?
At a meeting with business men in Nuuk in the autumn of 2016, CEO of Royal Arctic Line, Mr Verner Hammeken, was light on details on how exactly the cooperation with Eimskip will pan out. He mentioned that the service will go through Reykjavik and Torshavn with eventual call to other Eimskip ports like Fredrikstad, while Aarhus was to replace Aalborg as their main port, which was said to be too expensive. Aarhus opened for options in terms of cooperation with other parties.
As said earlier, Rotterdam is the main port in Icelandic transport networks and is increasingly used by the Faeroes. Currently Eimskip has 2 weekly services to Rotterdam, one leaving Reykjavik on Friday night via Reyðarfjordur and Torshavn to arrive on Tuesday in Rotterdam, from there to Bremerhaven, Aarhus and via Torshavn to Reykjavik, arriving on Tuesday.
The other service to Rotterdam leaves Reykjavik on Wednesday evening, calling Vestmannaeyjar, Torshavn and Immingham to arrive in Vlissingen on Monday, then Rotterdam on Tuesday, leaving within 24 hours to return to Reykjavik on Saturday night/ early Sunday.
This is obviously not the optimal route network, duplication.
Samskip has also 2 calls per week in Rotterdam both on Tuesday, one calling Vestmannaeyjar and Immingham before calling Rotterdam. The other calls coastal ports and port in the Faeroes on the way to Rotterdam. The coastal service returns on Monday while the larger vessel returns on Wednesday.
One the one hand it is difficult to see how a new ship of 2.150 TEU can be fully utilized without calling Rotterdam. On the other hand, it is also difficult to see how one ship can serve the Greenland trade on top of the established Eimskip business, calling both Rotterdam and Aarhus. In this context, it is worth mentioning that higher DWT of over 3.000 will allow more intake in Rotterdam (see later).
Lengthening the ship by one 40´+ bay would go a long way to accommodate all Rotterdam volumes
This remains an open question.
New ships, new technology, and significantly lower running cost.

Figure 11 An image of the bow of the newbuildings

Figure 12 The bow of the 22 year old Dettifoss in Hafnafjordur port
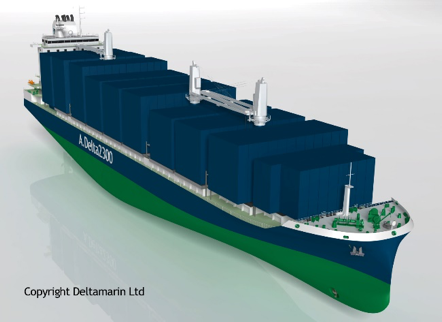
Figure 13 The image of the Deltamarin A.Delta 2300 design as it was presented 2015
The images above show the difference between the concept of perfect bow of two generations; Dettifoss built in 1995 probably designed a couple of years earlier when the cost of fuel was “manageable” and the bow of the Deltamarin design not yet built, presented in August 2015 as first state of the art container vessel of its series, “… to establish the best -in class design in terms of cargo capacity, flexibility and fuel economy.” It is also said to be adaptable to various customer´s requirements.
The Deltamarin layout is identical to the RAL/Eimskip version in terms of bays, 9* 40´and 2*20´, albeit without cranes in the RAL/Eimskip version, while said to carry 2.322 TEU as A.Delta 2300 but the RAL/Eimskip vessels are said to carry 2.150 TEU´s and be 8 meter shorter with the same width.
The Deltamarin concept as presented in 2015 was projecting “superior fuel efficiency of 33 kg fuel per TEU per day” apparently based on a speed of 19 knots with fuel consumption of 42 tonnes a day. This says nothing about whether sea-margin is considered. (see later).
Compared to the ship on the right, Dettifoss which carries 58% of the volume of the larger ship, will use 48,4 ton a day at the same speed, which if true, would result in the new ship´s consumption per TEU being only 60% of the older ship´s consumption per TEU. There are though reservations elsewhere in this article about the basis of the consumption estimate, which is relatively shallow design draught. There is no question, as larger ships use less fuel per TEU at the same speed and newer design are significantly more fuel efficient.
The cost of using ship for a voyage consist of 3 main components:
1. Capital cost
Slot cost reduces as the ships get bigger.
The cost of each ships is to some extent based on the exact specification and therefore any comparison here is entirely theoretical based on information in common domain.
The prices have been falling in the last few years but in 2013 an operator bought 3 * 2.200 TEU ships for $ 26 million each. Eimskip and RAL are buying 2.150 TEU ships for 32 million each. Part of the difference is due to higher ice class, and part due to high specification of the engine room, which in turn should lead to lower running cost , while the ships are gearless, which cost less than ship with cranes, which is the more common specification.
Assuming 20 years’ lifetime and 4% interest, the capital cost of each ship would be
| Per year | Per TEU slot/year | |
| 2150 TEU | $2.4 million | $1.095 |
If the interest rate was 2.5%, the annual payment would be 2,1 million
2. Operation cost
It consists mainly of cost of the crew, maintenance and insurance.
Ships in similar trade with very different capacity can have the same crew size. Therefore have the same cost per year irrespective of whether the capacity is 900 or 2.200 TEU´s, while the crew cost per slot of the larger is only 41% of the smaller ship. In international trade, the crew cost is $650´-900´ per annum, based on using crews from low cost countries; using “flag of convenience”. Here we use the term international crew. In the northern hemisphere, we have an example of average monthly crew cost of $ 70´ per month, $ 840´per annum. This compares with crew cost of comparable ships registered in the Faroes and as per DIS which are more than double the cost of the international crew. The crew cost per annum is $ 1,2 million less on a ship manned with international crew
This comparison does not tell the entire story. The Icelandic ships with local crews are on the most demanding routes, with short time in port, where there is significant overtime. The cost difference is still large.
The maintenance cost is primarily related to the age of the ship and how well it is equipped and maintained. In the context of this report, the difference in maintenance is not proportional to size, but increases somewhat with size and, of course, age.
There are 2 main types of insurance, own insurance which is related to the value of the ship and 3rd party insurance (P&I) which has other variables
For this comparison, $ 5.900 is used as daily operating cost for 2.150 TEU ship.
3. Fuel
Bunker cost is a product of several variables. The greatest is the market price of fuel. Then the economies of the ship (size, draught etc), and the speed of the ship and now environmental regulations.
Market price of fuel has varied. Peaked in 2012 at $640 per ton and fell to $ 109 on 210116. At the end of Sept 2017 stands at $ 321, while the average for the preceding 12 months was $ 289 per ton.
As the ships get larger the bunker cost per unit (TEU) reduces, which at the height of the oil peak contributed to surge in building very large containerships. That was not enough, and as there were too many ships the speed was reduced to save bunker cost. Subsequently the world fleet aimed at speed under or around 20 knots instead of 23-24 knots. As the ships are designed for certain speed, the last generation before the biggest beasts have been modified to gain the most optimal fuel consumption.
In the narration about the two ship types operated by Eimskip and Samskip mentioned earlier, both the types sail at speed well below the maximum one, to save fuel cost.
The load of the ship matters, as the lower in the water the ship is, the more fuel is required to maintain speed. To take an example of 1.730 TEU ship built in 2014, which has consumption of 35 tons per day, based on certain condition at a draught of 10,5 m at speed of 17 knots, while if the same ship had draught of 9.5 m the consumption wold be 29 ton per day. The difference in payload is approx. 5.000 tons.
The new buildings will be ice strengthened to class 1A, which means that 6% more steel is required to strengthen the hull leading to 1% increased consumption compared with similar ships in same condition without ice-class.
Two years ago, the North Sea was declared a Sulphur Emission Control Area (SECA) where use of heavier fuel was banned, which leads to 100% increase in fuel cost within the zone, which in the case of Nuuk - Aalborg, the last 1.150 miles are within the SECA area, approx. 26% of the total distance .
In 2020 the use of fuel with sulphur content higher than 0,5% will be banned globally. The cleaner fuel will obviously be more expensive than the current one with max 3,5% sulphurcontent, but less expensive than the 0,5%.
It has been mentioned that the newbuildings will be equipped with scrubbers which cleans the exhaust to comply with cleaner standards. This technology is one of many considered to deal with the new “fuel environment”. Maersk has decided not to use scrubbers. Same applies to probably the majority of ship operators.
Fuel consumption and information
The information from Deltamarin gives the service speed as 19 knots and has said that this is based on design draft, not scantling draft (maximum). The problem here is that the design draft is unknown.
The information was for 8-meter-longer ship with 3.400 less DWT than the RAL/Eimskip version. The displacement difference is 9% on a fully laden ship between the two options.
The difference in deadweight between scantling draught and design draught based on similar ship with a DWT of 30.000 and draught of 10,5 and design draught of 8,75 would be in the region of 7.500 ton, or between a full ship with a gross weight of a TEU of 13,3 or gross weight of 9,9 ton.
The challenge in reading information about fuel consumption, is that there are at least 2 schools of thought, the selling one, which states that the consumption is based on clean/smooth bottom, even keel, wind max BF 2, sea not exceeding 1 m etch. Another states 10-15% sea margin which[1] “ .. allows to make up for delays owed to bad weather or port overstay”[2]. Then, one must consider whether shaft generator is coupled, and other similar issues. Connected reefer containers which may be few or many, can cause confusion in this context. My personal view is that it is a special type of cargo which is charged accordingly and should not be included as regular running cost.
The presentation from Deltamarin includes 15% sea margin.
The DWT of the 2 types to be replaced it is 26.590 t. The guess here is that with corresponding draught, the consumption at 18 knots will be 43-44 tons. At full scantling, maybe 45 tons.
Using the “Cube rule” the calculated consumption of the 2.150 TEU ship at 16 knots would be 35 ton. Based on the same method sailing at 14 knot requires 23,4 tons a day.
These figures are just indications, while reasonable indication in the context of assessing economies of scale in smaller containerships designed with high oil prices in mind.
The envisaged schedule of the 3 vessels: Nuuk, Reykjavik, Torshavn, Rotterdam, Bremerhaven, Aarhus, Torshavn, Reykjavik, Nuuk is approximately 5500 miles long. Thereof 2.100 miles inside the SECA zone, which requires the use of Marine Gasoline, MGO which is 50% more expensive than the regular IFO 380. It would be prudent to assume that at lease the last 55 miles to the port of Nuuk would be on MGO. Based on the same speed inside and outside the SECA the extra cost of the SECA passing is 20% on top of identical total distance, or each average mile.
Furthermore, most of the time containerships sail with considerably less load than leads to scantling draft. Imports would be less dense than exports when the products are frozen seafood and aluminium in containers. It might be assumed that less than 40% of a full round would be on maximum permitted draft.
Bunker on the Nuuk Leg
The assumption is that there will be continuous service throughout the year. In the absence of concrete information on comparable volume, it has been assumed that inbound annual volumes to Nuuk are 200.000 tons and with tare and empties would translate into load of 250.000 tons per annum each way which would be 5000 ton per sailing.
A likely lightship weight is 10,000 tons, “stores are considered as 5% of Dwt, 1250 ton. Thereby the displacement of the ship in the leg between Reykjavik and Nuuk would be in the region of 16,000 tons, which will require ballast.
Thereby the ships would have a draft of approx. 6 -7 m which reduces fuel consumption considerable. Here it is assumed that the consumption at 16 knots for the 2150 TEU ship would be 26-27 tons per day for main engine only.
FOUR CHOICES
The cooperation with Eimskip appears to be shoo-in: a natural continuation of two decades’ cooperation (a limited one, though). To view it in the context of other alternatives here are listed in all 4 other options:
- Replace the main line vessels and operate independent service with 2 vessels, eventually calling Hirtshals instead of Aalborg.
- Making Reykjavik the main hub and RAL operating Mary and Malik in a combined shuttle traffic between Reykjavik and the ports on west and East coast.
- Cooperation with Samskip or any other who might be interested in extending its operation across to Greenland, like Smyril Line.
- Cooperation with Eimskip with 3 ships as described
Hereby there will be attempts to analyse the options in terms of 3 elements:
- Cost
- Service
- The effect on the competition on the North Atlantic
I: Two ships in shuttle service between Nuuk and Aalborg/Hirtshals service eventually calling Torshavn/Reykjavik
This will require 2 ships capable of sailing at speed of 18 knots. Size might be 800-1000 TEUs.
In this context there are 2 options: to charter or to build.
There are many ships in this size bracket in use in the Baltic which have the A1 ice class. Two main players, Maersk and Containerships are reorganizing their fleet with newbuildings which partially, at least, replace existing fleet. Containership of this size are chartered for $ 6-7.000 a day. But the ice class might add to that a bit, so we assume here $ 8.000 per day.

Figure 14 2 * 40´ lifted in one go from a RAL ship. 4 TEUs. As significant part of the flow is empties, such handling will shorten the turnaround time. Photo: PH
New buildings of the same specifications could cost $ 21 million, annual payment of $1.55 million. The operation cost, as above, 2.2 million per year and bunker roughly the same as for the chartered option.
The distance between Nuuk and Aalborg is 2.230 nautical miles. It is 32miles shorter to Hirtshals. These miles count heavier as they are within the SECA area where 0.1% sulphur is the max. This shorten the roundtrip by 4 hours. Average speed of 15,5 knots per hour leads to 144 hours per leg, which in turn allows 24 hours in port. If a turnaround can be achieved in 18 hours, there are 6-hours to spare, to meet bad weather, - or in good weather to reduce speed especially within the SECA zone. Of course, there is engine capacity to go faster to catch up.

Figure 15 Linda, 908 TEU with Ice class 1A. Same type as Arnarfell is sailing for Containerships in the Baltic
The basis for real shuttle service is fast turnaround at each end. The operation in Nuuk has been as good as the facilities allowed. With the new terminal, I am in no doubt that a ship can be turned around in less than 18 hours with 2 cranes. The counter port shouldn’t only have the equipment to turn ship around fast, but organization which can, which mean a lean organization ready on arrival with everything prepared and continues until departure. This might require some creativity within the prevailing laws and safety rules.
Cost
With a daily rate of $ 8.000 per day, the chartering option calculated as $ 29 less expensive than having new own ship costing $ 21 million, or 6%. The new ships are assumed to be 10% more fuel efficient while the capital cost eats up the difference.
It is not applicable to calculate the slot cost as the market is finite and the cost must be shared based on paying units. Here paying TEU´s are assumed to be 40.000.
The calculated cost per paying TEU is $ 335 for new ship and $ 314 per paying slot per leg. The difference is probably within margin of error.
Service
Apart from eventually calling Hirtshals, there is no change except there is no provision for calling Reykjavik. Which is a deviation of 115 NML, which requires 8 hours at speed of 15.5 knots. By calling Reykjavik or Torshavn the speed must be increased, which most of the year isn’t an issue, just cost. Here for example, calling Reykjavik with 4 hours in port will require compensating for 12 hours for the deviation which means that the speed must be 16.7 knots, which in turn leads to increase in fuel cost by approx. $ 10.000 per call.
If Torshavn would be used for transhipment into another network, the deviation would be less than half of the one to Reykjavik, probably compensated by using Hirtshals instead of Aalborg.
It has been assumed that due to weather and less volume, that during 3-4 months of the year the service would be changed to every 10 days instead of a weekly one, like the current setup, which appears to be mainly economical/ lesser volumes, not due to weather, therefor the basis in 48 roundtrips. Weekly service is technically possible but cost more fuel, $ 14 per paying TEU.
Generally, this offers the shortest transit time to and from Denmark.
The effect on competition on the North Atlantic
The effect on competition is limited but opens for using more partners than just Eimskip, like Smyril Line.
II: Making Reykjavik the main hub and RAL operating Mary and Malik in a combined shuttle traffic between Reykjavik and the ports on West and East coast.
This opens a lot of options for the Greenlandic trade. This is not based on a fixed tie-up with a shipping line, but allows importers and exporters in Greenland to shop for option offered by those who sell sea freight to and from Iceland, currently Eimskip Samskip and Smyril Line, while in the future if anticompetitive measures undertaken by the carriers are lifted, the options will be much greater, albeit on the same itineraries as the current ones. This is especially pertinent for goods requiring on- or pre-carriage.
One might note that Mary has capacity for 572 TEU and Malik 606 TEU´s while Nuka and Naja have capacity of 782 TEU. There appears to be shortfall of 180 TEU, which should be taken into account.
Ideas on how to deal with the shortfall:
- There are significant seasonal variations, and the peak import season is during the summer when low value building material take up significant space, it would be natural to during the first 4 months of the year to offer lower freight rates to induce shifting of volumes from the peak season.
- RAL has relatively high number of empties which could be rationalized to allow for more paying goods during peaks. One might also see when the cost model changes there might be incentives to load more per box.
- Learning from the Maersk experience, one might speculate whether raising the wheelhouse to allow for one extra layers of containers on deck at least the 4 last 40´ bays giving 56 TEU´s, which would be only used for empties.
Cost
52 voyages of 2.170 miles and operational cost of 2 crews assuming on Scandinavian conditions will cost $ 10 million with no contribution to capital or fuel during the time used for coastal service in Greenland, where the ships have 6 days a week, which could be used for covering open ports to the north and south of Nuuk, Aasiaat, Sisimiut and Nanortalik.
The final cost of this solution is based on what agreement can be reached for the pre-and on-carriage and the value of the inland legs which subtracts from the cost of the operation. Also, cost of transhipment in Reykjavik.
Service
This allows for weekly service throughout the year where the ships would call the main ports at the coast within the 14 day cycle. The transit time from Denmark to Nuuk would be slightly longer than the direct service, depending on the transit in Reykjavik.
The effect on the competition on the North Atlantic
The Greenlandic traders and exporters will have the options to shop for the best deals on offer through Iceland.
If there is more than one carrier operating out of Iceland one should assume that the available cargo will be fought for, which assumes that all the containers will not only boost one of the competitors but to disrupt the prevailing balance.
Therefore, one must assume that this type of setup will have positive effect for all freight buyers in this part of the world.
Additional note:
If there was a plan to separate RAL´s Atlantic service and the coastal one, this option goes against it.
III: Cooperation with Samskip or other parties who might be interested in extending its operating across to Greenland, like Smyril Line.
Although Smyril Line is mentioned, their presence is currently concentrated on a niche market in the east of Iceland and weekly roro service from Thorlákshofn to Rotterdam via Torshavn.
As the model of cooperation between RAL and Samskip discussed here doesn’t require extensive investments, the contract would therefore be shorter and more open.
One of the peculiarities of the proposed cooperation RAL / Eimskip is to send every week ship with 2150 TEU capacity from Reykjavik to Nuuk carrying on average ≈ 600 TEUs each leg.
By using ships of approx. 900 TEU capacity, which is not that dissimilar from current ships the load would be split-up in Reykjavik. One can think of a route Nuuk- Reykjavik – Vestmannaeyjar – (Torshavn) – Immingham – Aarhus – Varberg – Torshavn – Reykjavik – Nuuk on three weeks’ rotation. The goods intended for the continent would be transhipped in Reykjavik, which should result in well-utilized ships.
The challenge is that the Greenland trade takes up 2/3 of the capacity (which means it has to contribute 2 ships) while the question is with such tight space, whether the seasonal variation of each partner can be harmonized or will clash.
The cost of contributing 2 chartered 900 TEU ships and fuel for 5090 miles the cost per paying TEU will be in the range of $310, plus cost of transhipment of the RTM cargo in Reykjavik.
Just a footnote in the main text: Vestmannaeyjar is an important port for export of fresh and frozen goods from Iceland, but can’t accommodate ships larger than the Icelandic quartet. Most of imports to UK are discharged in the port of Immingham, as Grimsby few kilometres down the road is the transit centre for frozen food in UK and well connected in trucking down to the continent. Immingham has narrow locks while ships with up to 50% greater capacity than the quartet can use the locks. The size of the market in Vestmannaeyjar is not known, while cost of running 1.350 TEU ship is significantly less per TEU than the current size. It would be interesting to fully calculate the cost of calling the Vestmannaeyjar, especially by both the competitors in the Icelandic trade. I am not sure whether the shippers there pay the difference, or is shared by all the other customers.
Service
The transit time to Aarhus will be 2 days longer (albeit probably shorter than the “current” Eimskip setup). The Rotterdam connection is probably similar.
The effect on the competition on the North Atlantic
This would affect the balance in the current Icelandic trade, lead to more active competition, reduction of waste and over-service to some segments paid for by most of the users.
IV: RAL & Eimskip
Eimskip and RAL have from the inception of RAL had some cooperation, while with RAL´s new management, the conversation entered a new level.
Both the organizations have an aging fleet, needing replacement in the very near future, especially Eimskip´s where the 2 largest vessels are rather old, probably expensive in operation and are no longer big enough for the task. As will be mentioned elsewhere in this document, the level of containerization in Iceland reached saturation early on and the two sister vessels, Goðafoss and Dettifoss have been in Eimskip´s fleet for over 16 years.
The challenge with cooperation across to Greenland is twofold; a) the ships must be fit for Greenland waters, b) Greenland will be at the end of each round trip and therefore loop of 2170 miles, with only the natural goods to and from Greenland
The financial benefits of cooperation based on 2.150 TE ships are not obvious.
First the positive, the ships will get a good utilization as the peaks in each market are different, Greenland peaks after Iceland which is a bonus for both partners.
Cost estimate
Contributing with ship, one international crew and fuel for 5500 miles and having a 40000 paying TEU, the base cost per TEU is $ 225.
Alternative for Eimskip

Figure 16 Assessment of cost of running 1730 TEU ship in Icelandic trade
What if Eimskip had replaced the 2 ships of 1.457 TEUs with a standard 1.730 TEU ships which as per international brokers information are sold at $ 21,5 million. Taking into account investment in fuel economy but not ice-strengthening for Greenland and adding a premium of 19% we have an investment of $ 25,5 million. Ships of the latest specifications have earned a charter premium of around $ 1.000-1.300 per day compared with older similar tonnage. The 1.730 TEU vessels have 19% higher TEU intake and most likely use more than 25% less fuel per TEU mile than the ships to be replaced. Also, the 1730 TEU ships have compindex 13.1 of, while Godafoss has 11.1, which gives in all 40% higher DWT, which leads to higher utilization on the export leg. Annual cost for such ship on route Reykjavik, Reyðarfjodur, Torshavn, Rotterdam, Bremerhaven, Aarhus, Torshavn, Reykjavik 3.440 miles 52 week per year is approx. $ 9,9 million each with approx. cost elements as shown on the graph. Based on 60% slot utilization for paying TEUs (empties and some seasonal variations considered) the comparable cost is $ 186.
If the volume have grown beyond the 1.730 TEU for intended itinerary, it would give roughly the same results for Eimskip to operate the 2 ships they have ordered, on the current route of the 1.457 TEU vessels, with only one vessel calling Rotterdam per week and probably only one in Aarhus.
The straight calculation for Eimskip
They own and run 2 ships with Icelandic crews, and sail 5500 miles each, on a 3 weeks schedule. With Icelandic crews, the annual cost is $20,3 million. Having 1433 TEU´s on each ship the cost for each paying TEU (60% slot utilization) is $ 225. Bearing in mind that the weight capacity is 19% higher and Eimskip has heavy goods the cost might be somewhat less.
The benefits, based on assumptions mentioned here, show that having their own 1.730 TEU ships is financially more attractive and without the restrictions of being in a binding cooperation with other company having different culture/ background.
Cost
Eimskip has higher crew cost but better utilization, 90´ paying TEU (based on 60% utilization of the slots for paying cargo) therefore their calculated outcome is the same as the calculate share of operating one ship with 40´paying TEU´s which leads to the bottom-line of $ 225 per TEU for RAL
The cost indications above are reasonably close for the operation of ships, which is the main objective of the RAL/ Eimskip cooperation. However, that doesn’t mean that the split of cost is in line with the assumption presented here. The statements from the CEO of RAL maintaining the reductions in the freight cost of the Greenlandic market is not guaranteed, causes concern.
Service
Rotterdam is by far the biggest foreign port for Icelandic trade, up to 79% of containerized export measured in tonnes is destined for Rotterdam. The ships, the new trio is to replace, are by far the largest ships in Eimskip’s fleet. Therefore, it is unthinkable that the new ships will not have Rotterdam and by default Bremerhaven or a German port as ports of call. It means that the ship from Greenland will call Torshavn, Rotterdam and Bremerhaven before calling Aarhus, which leads to longer transit time by almost a week, compared with direct service.
Learning from the Faroes, Rotterdam has grown to be their second largest destination of exports. With Rotterdam, and subsequently Bremerhaven, called in the RAL cooperation will ensure minimum transhipment and fastest transit time to these growing ports, slightly longer to Aarhus and the same for imports, except that imports through Rotterdam and Bremerhaven will have no transhipment and shorter transit time
In RAL's presentation to the business community in the early autumn of 2016 it was highlighted that a new sailing system will open for more value adding activity in Nuuk and more products when shipped ready for the market, which is only to a small extent in Denmark.
If Greenland will in the long term have a similar trading pattern as the Faeroes, 40% of the exports will go through Aarhus, while Rotterdam will have 33% %, Immingham 22% and German port 4%. The conclusion concerning exports from Greenland is that the transit time on average for exports will shorten in totality in the future.
On the other hand, the transit time for imports to Greenland will be 2+ days longer due to call at Torshavn and Reykjavik. If we again look at how the Faeroes trade, then 87% of containerized imports are coming loaded in Aarhus, 11% in Rotterdam and the rest divided between UK and Germany.
The regular calls in Reykjavik on the way to Nuuk will open the opportunity for Greenlanders to buy more fresh products from Iceland instead of Denmark, especially as the intention is to have this service throughout the year, no 10 days frequency during the winter.
The effect on the competition on the North Atlantic
This cooperation will strengthen Eimskip´ s hand in the competition, being able to operate larger ships at somewhat lower cost. As is now the market is divided 1/3 Samskip and 2/3 Eimskip. As the scale effects make the operation of the larger company less expensive than the smaller one while selling at similar prices. This is a clear assumption as there is no statistics available, while all the research in buying behaviour of container transport, indicate that globally it is seen as commodity and the way to secure business is to offer lower rates or rates which are equal or very close to being equal to the lowest.
It is in the interest of the one with market dominance to have a smaller competitor as his production cost sets the floor for the rates. But the cooperation gives Eimskip strength to fight off any attempt to competition threatening their position and continues to allow them to attempt to expand mainly through acquisitions abroad.
Note on cost.
The cost referred to is only approximate for ship related cost. Containers are not included in the calculation which for a dry box might be as high $ 30 per leg. Port cost is also excluded but not a major cost element.
Other opportunities in the cooperation
Having a common container fleet, totally or partially will reduce cost for both parties. Same applies for using the same container freight stations (CFS).
Then, for the benefits of exporters of frozen goods from Greenland and of course Iceland and Faroes, using 45´container instead of 40 will safe inland haulage cost, and will also safe cost for importers of perishable goods to respective countries.
The challenges for monopoly
A market 1.100 mile from nearest commercial port and has a total market in the region of 40´ paying TEUs per annum, cannot support more than one operator. There is a natural monopoly. The same market supports 3-4 hauliers in Nuuk and it may be preferable to have more than one warehouse operator (CFS), and if so the main carrier shouldn’t operate it.
Then there is a question whether the synergies between domestic service and the Atlantic one are so strong that they can’t be separated.
If operation of ships and connection to ports is a utility, then preferably the utility should sell slots at cost as a wholesaler to retailers which could be NVOCC´s, forwarders and eventually other shipping companies eager to have direct access to the exporters and importers in Nuuk.
Thereby the overheads of the ship operating entity would be reduced. There is nothing wrong with if the same operator provides, when needed containers, but that should be optional.
The effect of new airport in Nuuk
Earlier in this text, the lack of growth in the Greenland trade has been mentioned, which is based on historical data. This text has at times tried to learn lessons from what has been happening across the three countries, Iceland, Greenland and the Faroes.
It is highly likely that within few years, Greenland will have a new international airport in Nuuk, which could open Greenland up to much more tourism and subsequently more commercial flights by aircrafts large enough to carry significant volumes of cargo.
Part of the tourist population consist of people exploring new territories and / or are interested in relatively unspoiled nature. Greenland, when easily accessible, will be a prime destination for such tourists, especially if required infrastructure and competence is in place. A significant part of the tourist visiting Iceland are flying from USA. It is likely that Greenland would enjoy similar interest, albeit probably not on same scale at the beginning.
It would be reasonable to assume that in the not to distant future there would to daily departures from Nuuk to the European continent and US on top of the Copenhagen flights. These flights would have bellyhold capacity for cargo to and from Nuuk. This capacity would be great incentive to locate seafood processing capacity in the vicinity of the airport, maybe close to the SIKUKI terminal, to be able to get the most value out of the catch in Greenland waters palatable to discerning buyers of fresh seafood on the two continents.
This could somewhat reduce the export by sea, unless new sustainable quotas to be available, and increase imports by sea to cater for then fast-growing industry, tourism.
Conclusion
This study confirms that, despite long underutilized legs, the benefits of scale of using large vessel make the size of vessels intended in the cooperation between RAL and Eimskip the most economical option. This is subject to assumption on cost sharing presented earlier in the text. This should also provide more reliable service than the population of Greenland has had. It also concludes that Eimskip would achieve the same benefits of scale by using pair of own operation 1.700 TEU vessel to the continent as an alternative to the RAL cooperation.
It doesn’t comment on the benefits of closer operational cooperation between the two main carriers in Iceland, Samskip and Eimskip, which the author of this document has previously published[3], which would have given more benefits for the Icelandic trade than the proposed Eimskip/ RAL cooperation, especially if connected to the second of the four choices mentioned here earlier in the text, II Making Reykjavik the main hub and RAL operating Mary and Malik in a combined shuttle traffic between Reykjavik and the ports on West and East coast.
To mix a monopoly in Greenland with a company with 2/3 market share in Iceland which would be considered to be very close to be a monopoly, is something which has to be very carefully managed. Governments should be aware of the global discussion about the risk of Oligopoly/ Monopoly in shipping.
In markets with no or limited competition this is much more acute discussion.
This article was intended to contribute to that discussion.
Finally, we are living in a fast-changing world, and the basis for this article is material in public domain and conclusion drawn from it, some of it might be dated. No contact has been made with any of the operators.
The main issue is not to leave such important subject only to the operators.
1 December 2017
Pall Hermannsson
Notes:
[1] Sea margin and heavy weather: If, at the same time the weather is bad, with head winds, the ship’s resistance may increase compared to operating in calm weather conditions. When determining the necessary engine power, it is normal practice to add an extra power margin, the so-called sea margin, which is tradition-ally about 15% of the propeller design (PD) power. MAN B&W MAN B&W MC/MC-C, ME/ME-GI/ME-B engines 198 38 33-8.4
[2] Source: Alphaliner Glossary 1999-2012
[3] http://www.pallhermannsson.com/new-page-2/ short version in English written in 2014, http://www.pallhermannsson.com/samkeppniskipafelaga/ and http://www.pallhermannsson.com/flutningskostnadur in Icelandic